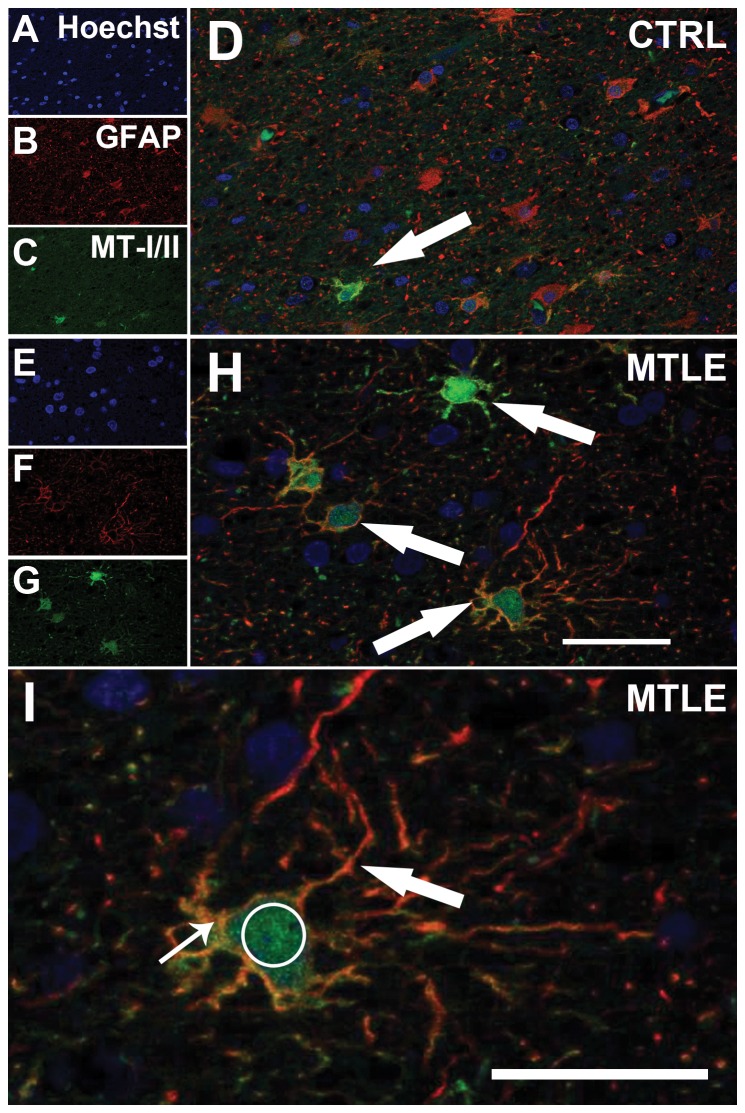
Figure 8. Confocal images of astrocytes expressing MT-I/II in Ctrl and TLE cases.
TLE (E–H) patients presented more astrocytes (GFAP immunoreactive cells, red in B, F, D, H and I) expressing MT-I/II (green in C, G, D, H and I, indicated by white arrows in D and H) than Ctrl (A–D). In a detailed view of H (I), MT-I/II expression can be observed in radial branches (large arrow), soma (small arrow) and nucleus (Hoeschst 33342 staining, white circle) of astrocytes. Astrocytes are GFAP immunoreactivity) Bars in H and I indicate 50 micrometers.

