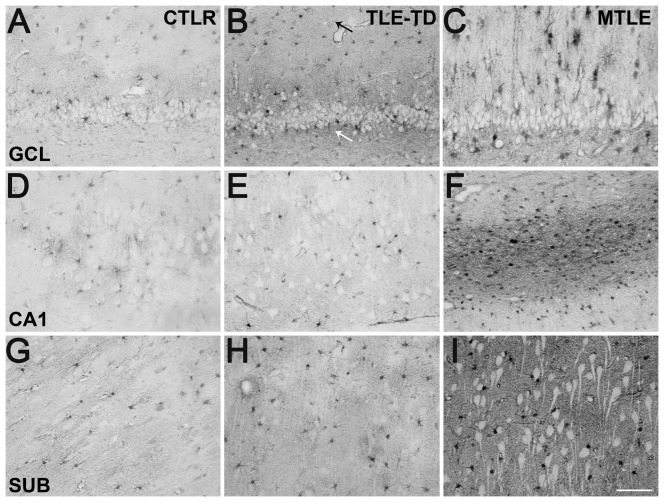
Figure 9. Representative sections of MT-I/II immunohistochemistry in hippocampal subfields from Ctrl, TLE-TD and MTLE patients.
MTLE patients had widespread increase in MT-I/II when compared to Ctrl, demonstrated by increased cellular and neuropil staining in C, F and I. In TLE-TD patients, increased MT-I/II expression was observed only in the fascia dentata (B) outer molecular layer (small black arrow) and subgranule zone (small white arrow), the entry point of the hippocampus. The representative images shown are from the fascia dentata (A–C), CA1 (D–F) and subiculum (G–I). Bar in I indicates 100 micrometers.

