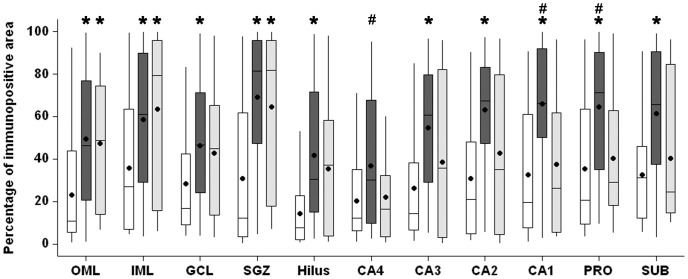
Figure 10. MT-I/II immunopositive area in hippocampal subfields of Ctrl, MTLE and TLE-TD groups.
Compared to Ctrl (white boxplots), TLE groups had higher MT-I/II immunopositive area (showed as percentage of immunopositive area) in outer molecular layer (OML), inner molecular layer (IML) and subgranule zone (SGZ) (p<0.01). MTLE (dark gray boxplots) had increased MT-I/II immunoreactivity in granule cell layer (GCL), hilus, CA4, CA3, CA2, CA1, prosubiculum (PRO) and subiculum (SUB) (p<0.05), compared to Ctrl, and also in CA1 when compared to TLE-TD (p<0.001). The * indicate difference from Ctrl and #difference from TLE-TD.

