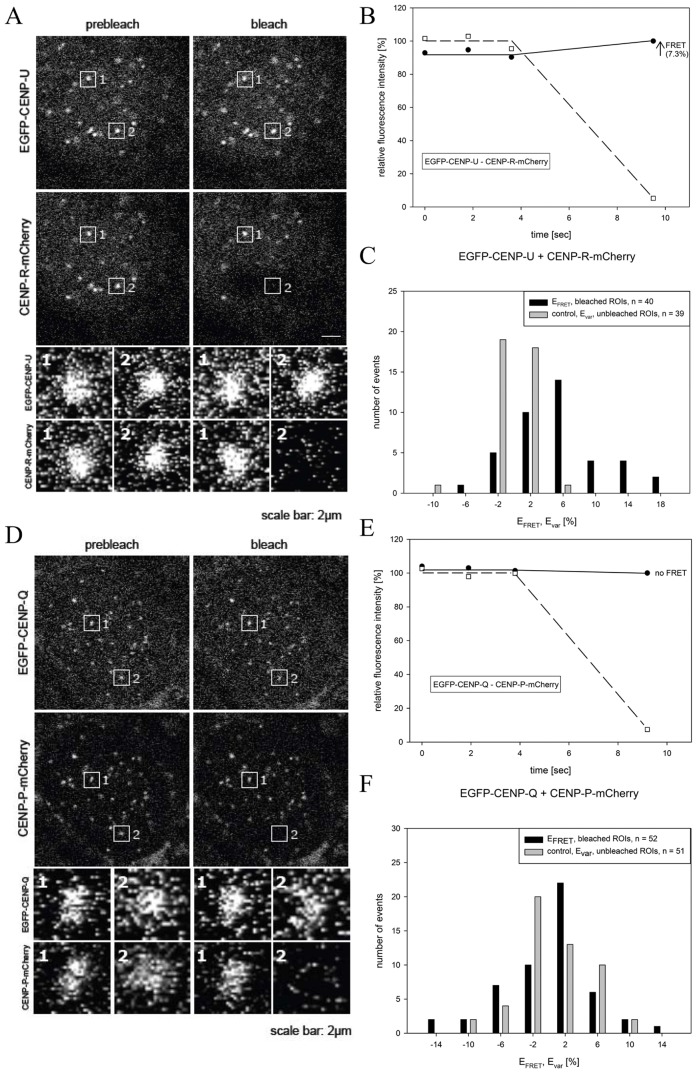
Figure 1. Acceptor-bleaching FRET of the protein pairs EGFP-CENP-U/CENP-R-mCherry (FRET signal) and EGFP-CENP-Q/CENP-P-mCherry (no FRET signal).
Typical HEp-2 cell nuclei are displayed in (A) and (D) showing centromere location of all four CEN proteins. Two of these locations, spot 1 and spot 2 in each of the two graphs, were selected for fluorescence intensity analysis before and after acceptor bleaching (see enlargements below). Spot 1 served as control and showed no detectable intensity change. At spot 2, the acceptor fluorophore mCherry was bleached (compare pre-bleach and post-bleach in (A) and (D)). In (B) and (E), the time course of the fluorescence intensity of the donor and the acceptor of both FRET pairs are shown. The acceptor intensities in the ROI (“region of interest”; open squares) were averaged and normalized to the mean intensity measured at the three time points before bleaching. The donor intensities in the ROI were averaged and normalized to the intensity measured at the time point after bleaching. Bleaching of the acceptor resulted in a fluorescence intensity increase of the donor (black dots) for EGFP-CENP-U (B) indicating the presence of FRET (see arrow), but no fluorescence intensity increase for EGFP-CENP-Q (E) indicating the absence of FRET. (C) and (F): Donor fluorescence intensity variation observed during acceptor bleaching normalized to the intensity measured at the first time point after bleaching. Control: spot 1 (acceptor not bleached) yielding Evar (grey bars), FRET measurement: spot 2 (acceptor bleached) yielding EFRET (black bars). For protein pairs indicated, number of observed single cases (grouped into Evar or EFRET value ranges of 4%) displayed versus values of Evar or EFRET. (C) EGFP-CENP-U (donor) and CENP-R-mCherry (acceptor): distribution of EFRET (40 bleached kinetochores) is clearly distinct from the distribution of Evar (39 non-bleached kinetochores) indicating FRET. (F): EGFP-CENP-Q (donor) and CENP-P-mCherry (acceptor): distribution of EFRET (52 bleached kinetochores) superimposes the distribution of Evar (51 non-bleached kinetochores) indicating no FRET.

