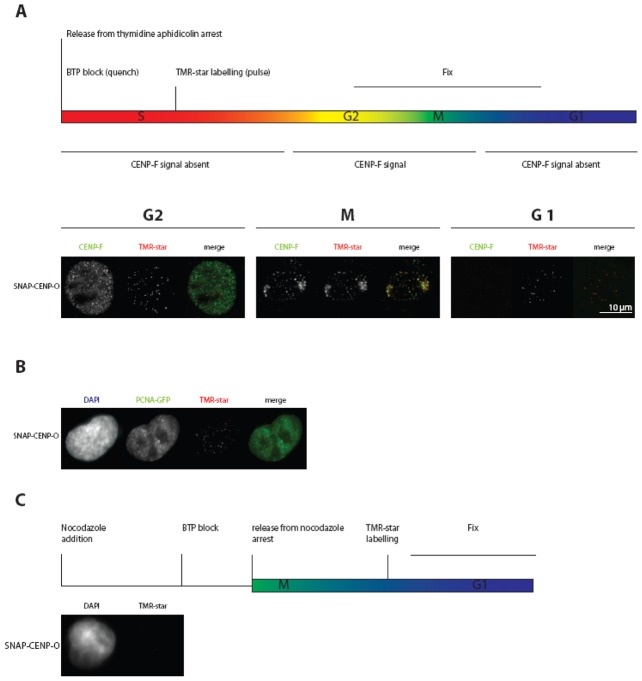
Figure 5. CENP-O loading to kinetochores measured by the SNAP-tag technology.
(A) Top: schematic representation of the performed experiment. Below: representative images of cells showing TMR-star fluorescence for SNAP-CENP-O in G2, M-phase and the following G1. Cell cycle phases G2 (CENP-F staining of the whole nucleus) and mitosis (specific kinetochore binding of CENP-F) are clearly identified. (B) The same experiment as in (A) was performed with U2OS cells stably expressing PCNA-GFP. SNAP-CENP-O fluorescence appears at kinetochores in late S-phase as judged from cellular PCNA distributions. (C) Top: schematic representation of the performed experiment. Below: representative images of cells expressing SNAP-CENP-O showing no fluorescence at kinetochores during G1. CENP-O is thus loaded to kinetochores in S-phase.

