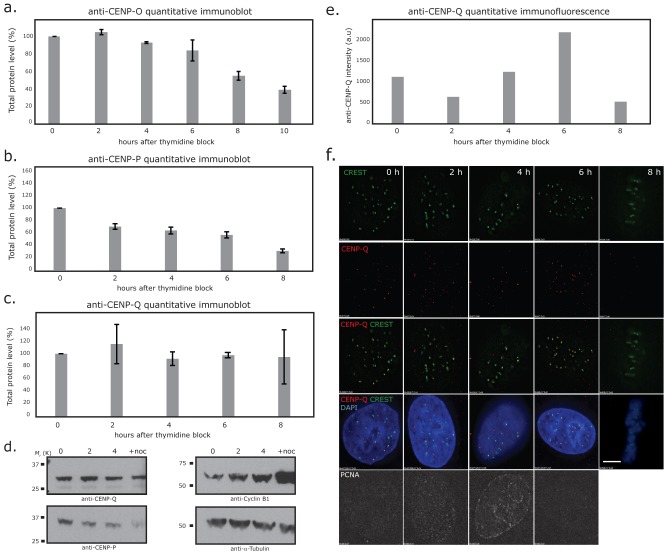
Figure 7. Levels of CENP-O/P/Q total protein during the cell cycle.
(A) Quantitative immunoblot of CENP-O relative to α-Tubulin. Protein amounts are measured at G1/S (0 h), 2, 4, 6, 8 and 10 hrs after release from the double thymidine block in synchronised human HEp-2 cells. CENP-F and PCNA staining identify the time points 2, 4, and 6 hrs as S-phase, time point 8 hrs as G2 and 10 hrs as M-phase. The cellular amount of CENP-O reduces in G2 and further in M-phase. (B, C) Quantitative immuno-blots of CENP-P and CENP-Q protein levels relative to α-Tubulin at 0 (G1/S), 2 (early S), 4 (middle S), 6 (late S-phase), 8 (G2) hrs after release from double thymidine block in synchronized HeLa cells. Cycle stages were attributed from FACs analysis, PCNA staining and phase contrast microscopy (data not shown). (D) Representative immunoblots showing CENP-P, CENP-Q, Cyclin-B1 and α-Tubulin at the 0 (G1/S), 2 (early S), 4 (middle S) hrs time points and cells arrested in mitosis with nocodazole (16 hrs). (E) Quantitative four-colour immuno-flourence using anti-CENP-Q (red), CREST (green), DAPI (blue) and anti-PCNA (far red) antibodies in the same cells used in panel B. Pixel intensities of CENP-Q (signal – background) at kinetochores (n = 50 from 5 cells) are shown for each time point after release from double thymidine block (E) and representative images (F). CENP-Q loads onto kinetochores during S-phase reaching maximal binding in late S-phase (6 h). Scale bar = 5 µm.

