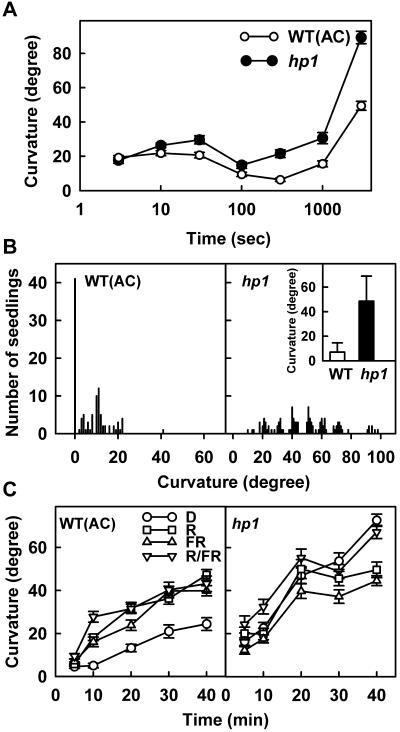
Figure 2.
A, Dose-response curve for wild-type and hp1 mutant seedlings. Dark-grown seedlings were exposed to a single pulse of blue light of varying duration and were returned to darkness. The curvatures were recorded 2 h after the beginning of light exposure. B, Frequency distribution histogram of time threshold for second-positive curvature of the wild-type mutant with the hp1 mutant. The seedlings were exposed to blue light for 10 min and were returned to darkness. Curvature was measured 2 h after the beginning of light exposure. The inset shows the comparison of the mean curvature value (±sd) of the wild-type mutant with the hp1 mutant. C, Time threshold comparison of wild-type seedlings with the hp1 mutant. Dark-grown seedlings were exposed to blue light for the duration indicated on abscissa or were exposed to 5 h red, far-red, or red light followed by far-red light 90 min before the onset of blue light exposure. Curvature was measured 90 min after the beginning of blue light exposure.

