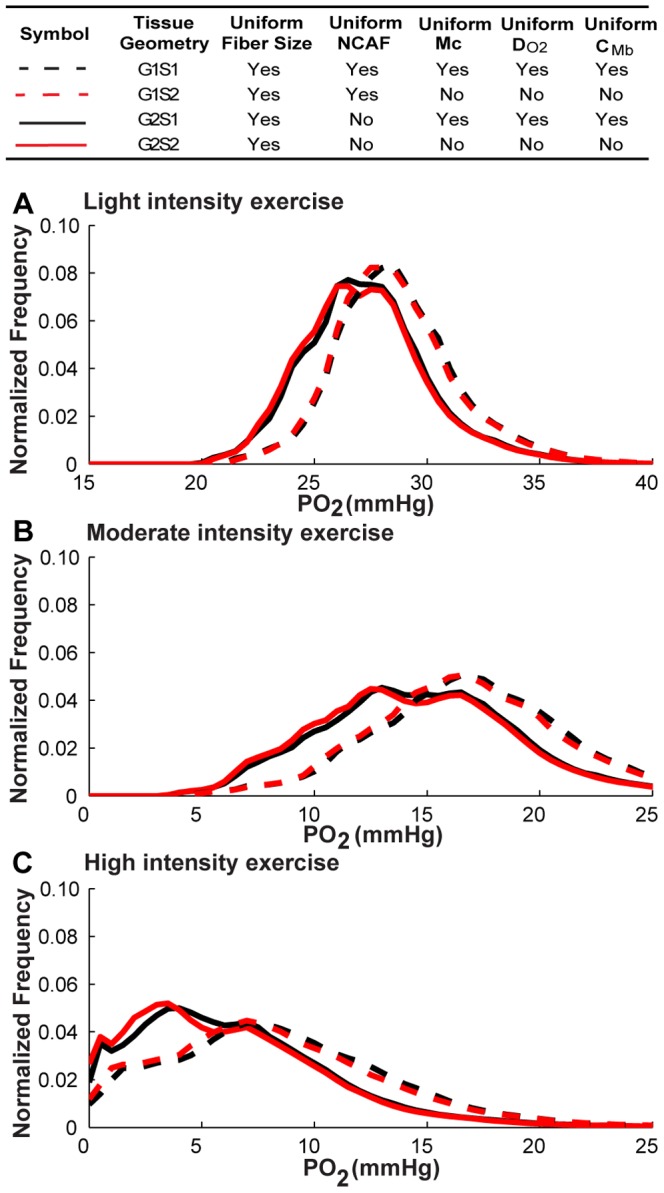
Figure 3. PO2 histograms for muscle geometries with uniform-size fibers under exercising conditions.

Fiber PO2 probability distribution profiles in muscle tissue under A) light intensity exercise conditions, volume-averaged M c = 3.34×10⁻⁴ mlO2 ml−1 s−1; B) moderate intensity exercise conditions, volume-averaged Mc = 6.68×10⁻⁴ mlO2 ml−1 s−1 ; and C) high intensity exercise conditions, volume-averaged M c = 1.02×10⁻³ mlO2 ml−1 s−1, for simulation cases G1S1, G1S2, G2S1, G2S2. Dotted lines are simulation results for G1 geometry, while solid lines are results for G2 geometry. Black lines are the simulation scenarios S1 with uniform fiber-type properties (M c, DO2, CMb) and red lines are the simulation scenarios (S2 using fiber-type-specific parameters (except size) for different fiber types.
