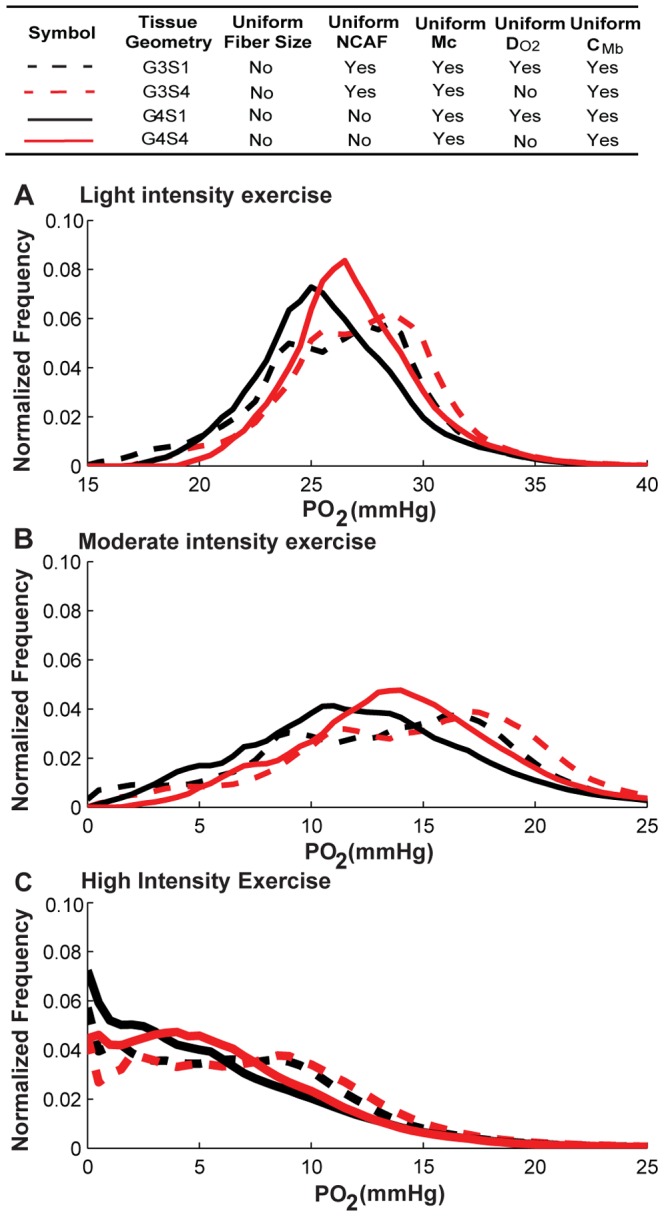
Figure 8. Effects of variation of oxygen diffusivity in different fiber types on PO2 histograms.

Fiber PO2 probability distribution profiles in muscle tissues under A) light intensity exercise; B) moderate intensity exercise; and C) high intensity exercise, for simulation cases G3S1, G3S4, G4S1 and G4S4. Dotted lines are simulation results for G3 geometry, solid lines are results for G4 geometry. Black lines are the simulation scenarios S1 and red lines are simulations scenarios S4 when DO2 is fiber-type-dependent while others use uniform values for different fiber types.
