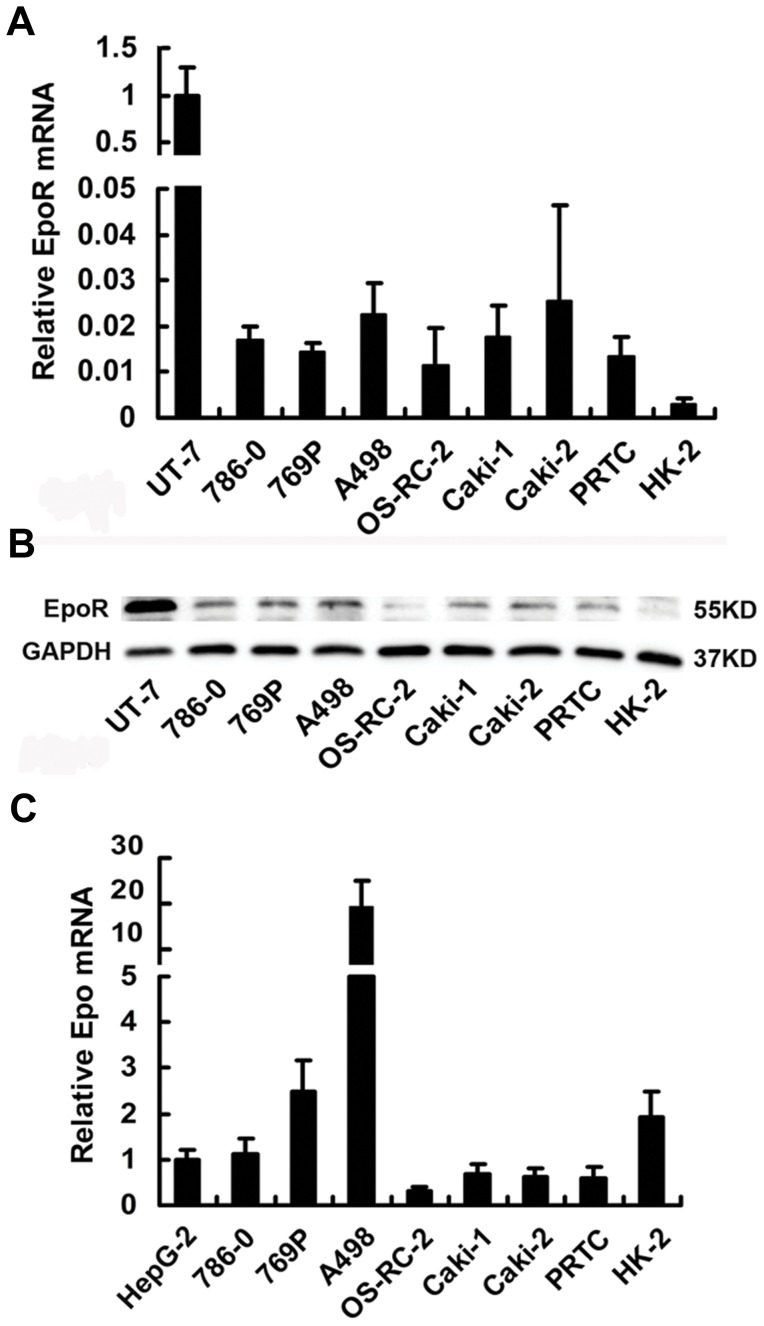
Figure 1. Epo and EpoR co-expression in RCC cell lines and primary renal tumor cells (PRTC) using HK-2, HepG-2 and UT-7 cells as controls.
Real-time RT-PCR was used for quantification of (A) EpoR mRNA and (C) Epo mRNA, western blot for (B) EpoR protein detection. Error bar indicates mean ± SD from 3 independent experiments.

