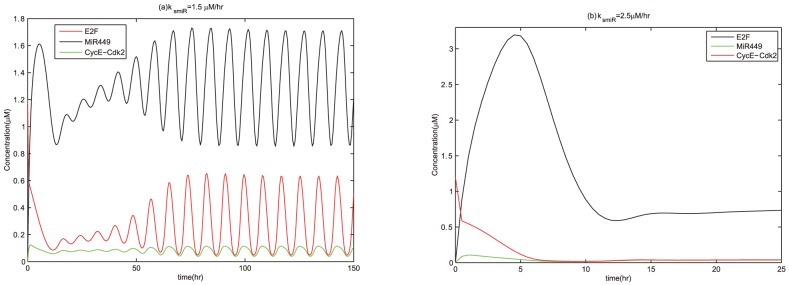
Figure 9. Time courses of [E2F], [CycE-Cdk2] and [MiR449] at  .
.
Assume initial conditions are [E2F] = 1.2, [MiR449] = 0, [Myc] = 0, [Cdk6] = 0, [CycE] = 0, [Rb] = 0.55, [PRb] = 0, [RE] = 0. (a)  . Set the Viewaxes run from 0 to 150 along the x-axis and from 0 to 1.8 along the y-axis; (b)
  . Set the Viewaxes run from 0 to 25 along the x-axis and from 0 to 3.3 along the y-axis.

