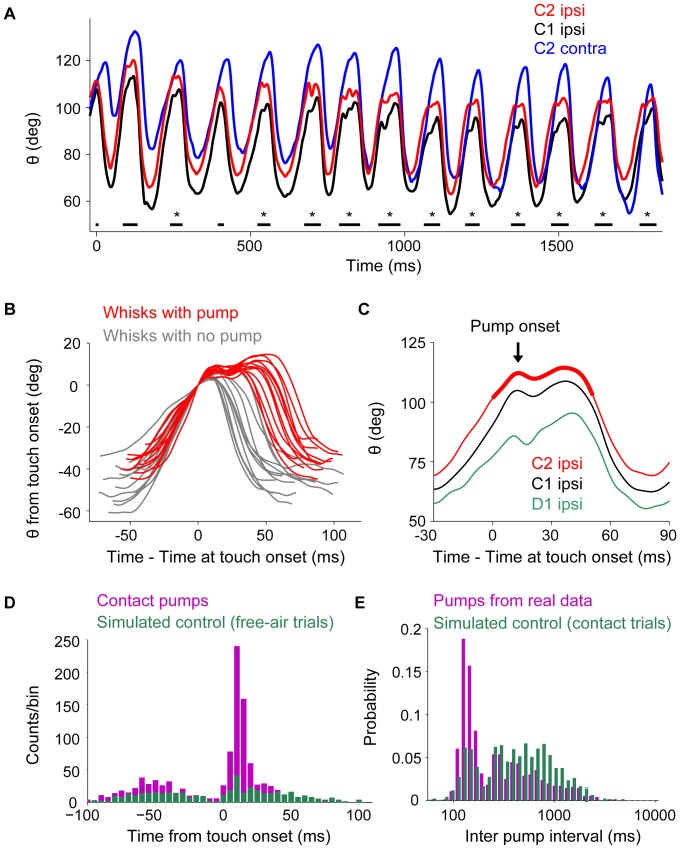
Figure 3. Fast, within-cycle touch-induced ipsilateral feedback.
A. Angle trajectory from a contact trial, filtered at 80 Hz. Whisker C2 (red) touched the pole near the end of protraction. Touch events are indicated by black horizontal lines. TIPs (manually detected in this example) are indicated by asterisks. The first touch depicted was also the first touch in the trial. Data for ipsilateral C2 (red), ipsilateral C1 (black), and contralateral C2 (blue) whiskers. B. Angle trajectory of whisks with TIP (red) and without (grey), all taken from a single trial. Time and angle are presented with respect to their values at touch onset. C. Example of a touch-induced pump (TIP) that, after contact between whisker C2 and the pole, occurred simultaneously in the three untrimmed whiskers (C1, C2, D1). The C2 whisker was continuously in contact with the pole throughout the period marked touch (bold red line), so the whisker palpates against the pole without detaching from it. The TIP peak or onset (indicated by the arrow), the time of the first peak after touch, is followed by negative velocity. D. Time from touch onset (start of red bold line in C) to TIP onset (arrow in C) in contact trials (purple). The average latency of touch-induced pumps was 17.9 ms. The distribution of times between pseudo-touches (crossing of a threshold angle in free-air trials) and pump onset was normalized to have the same number of touches as in the contact data and is denoted in green. E. Inter-pump-interval (time between touch onsets in two neighboring whisks-with-TIP) with experimental (purple) and simulated (control; green) data. The control distribution is what is expected if the pumps had the same probability to occur, but were distributed randomly upon touch events. The peak around 140 ms is due to pumps that occurred in successive whisks (see Materials and Methods for detailed description on the controls used in Figs. 3D and 3E).

