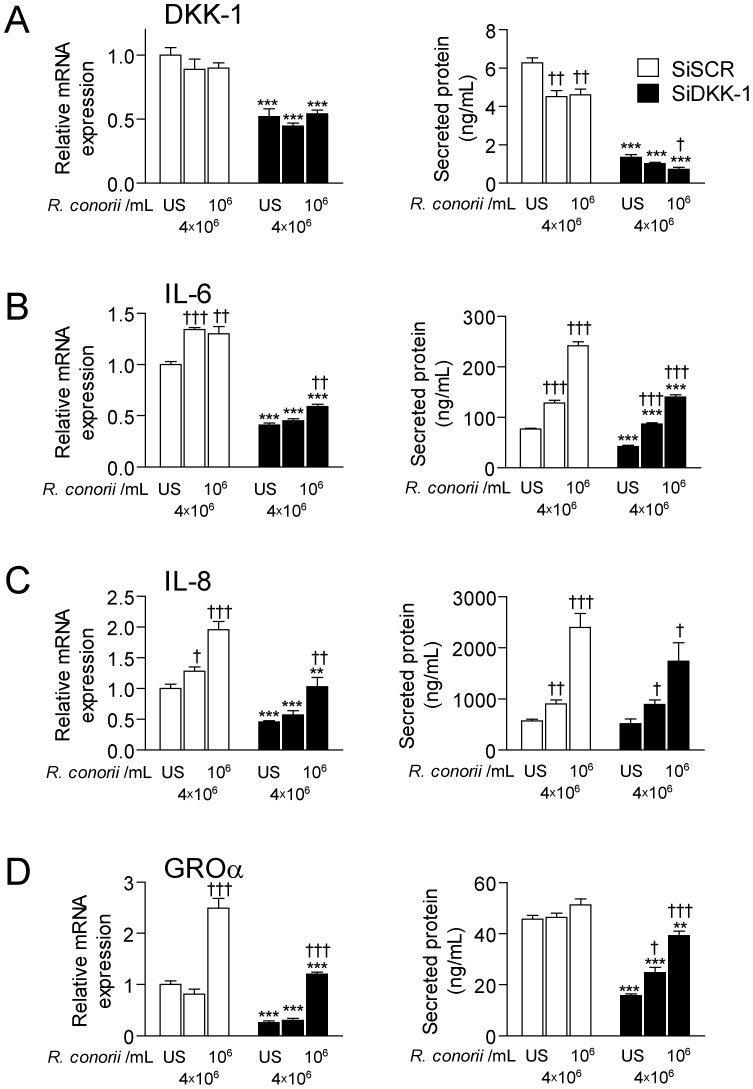
Figure 5. The effect of silencing DKK-1 on the R. conorii-induced cytokine levels in HUVECs.
The figure shows the effect of different concentrations of R. conorii in HUVECs on mRNA expression (left panel) and release of protein in cell supernatants (right panel) of DKK-1 (A), IL-6 (B), IL-8 (C) and GROα (D) in the presence (siDKK, filled bars) and absence (siSCR, open bars) of siRNA probes to silence DKK-1. Silencing for 24 hours plus culturing for 6 (mRNA) and 24 (protein) hours respectively. Data are given as mean±SEM (n = 4). **P<.01, ***P<.001 vs. siSCR treated cells (control cells). †P<.05, ††P<.01 and †††P<.001 vs. un-stimulated (US) siSCR treated cells.

