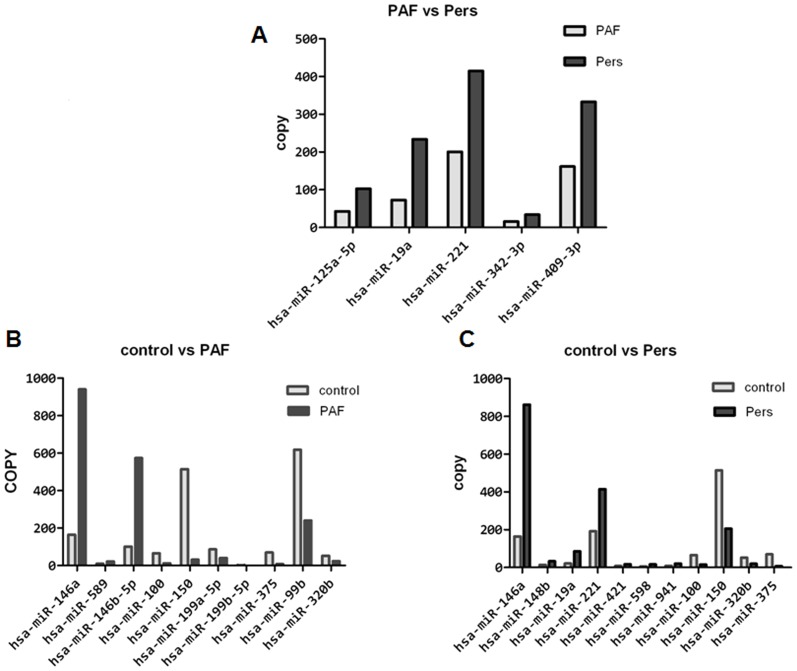
Figure 2. In-depth analysis showed specific miRNAs to be dysregulated in PAF, PeresAF and the control group.
Bargraphs showing mean copy values of the miRNAs that satisfied two criteria: having at least 10 copies in either PAF or PersAF groups and showing three-fold altered expression between either of the two pooled samples. (A) Five selected miRNAs in the PAF and PersAF groups. (B) Eleven selected miRNAs in the PAF and the control group. (C) Eleven selected miRNAs in the PersAF and the control group.

