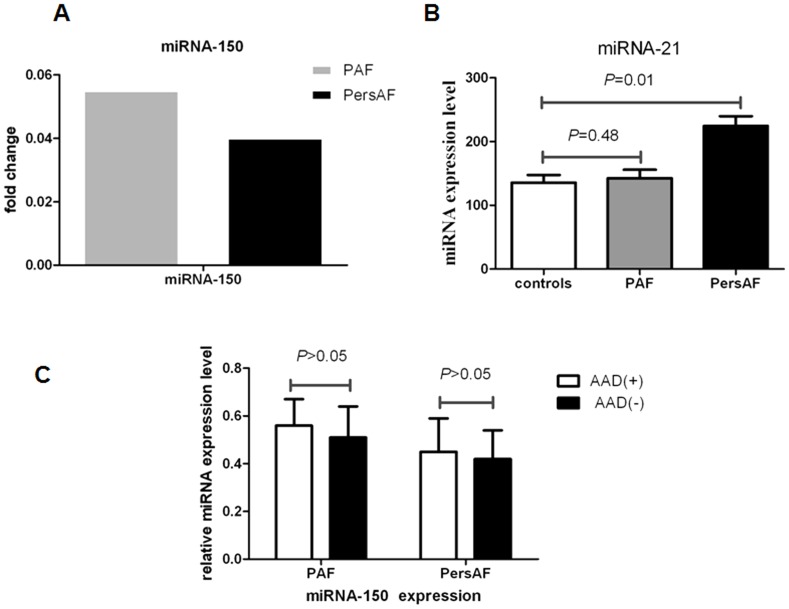
Figure 4. Expression levels of miRNA-150 and miRNA-21 in the AF patients.
(A) Fold change of miR-150 relative to the control group in PAF and PersAF. (B) Plasma level of miRNA-21 in PAF patients (n = 30), PersAF patients (n = 30), and the control group (n = 30). (C) Expression levels of miRNA-150 in the AF patients with antiarrhythmic drug therapy (AAD+) and without (AAD−).

