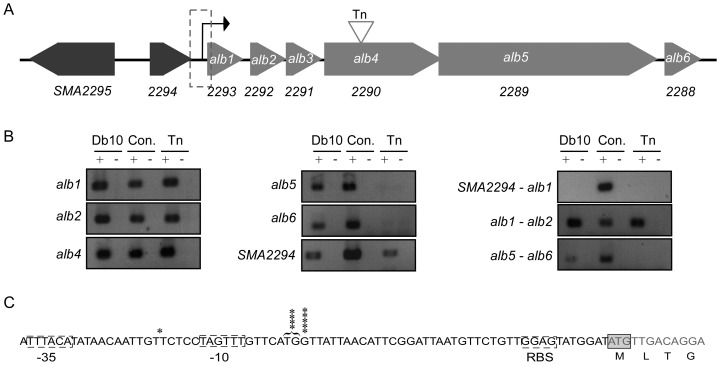
Figure 2. Transcriptional analysis of the alb operon.
A. Map of the alb operon. Genes belonging to the alb operon are indicated as light grey arrows, genes that do not belong to the alb operon are indicated as dark grey arrows. Each gene is shown to scale. The region upstream of the alb1 gene is highlighted by a broken box. The transcription start site is shown as a black arrow. The site of the transposon (Tn) insertion (at nucleotide 2745) in alb4 is indicated with a grey triangle. B. RT-PCR analysis of the biosynthetic gene cluster. The template used in the PCR reaction is indicated above the gels as Db10 (wild type S. marcescens Db10 cDNA) or transposon (Tn5 mutant cDNA). Reactions were performed in the presence (+) and absence (−) of reverse transcriptase. Con. represents S. marcescens Db10 genomic DNA as a positive control (+) and water as a negative control (−). The region of the chromosome amplified is indicated to the left of each gel. Primers were designed to amplify a product internal to a single gene, or spanning the intergenic region between two genes. Twenty five cycles of PCR amplification were used with the exception of SMA2294 and SMA2294-alb1 where 30 cycles were used. C. 5′ RACE analysis to identify the transcriptional start site of the alb operon. The region upstream of the alb1 gene is shown and the methionine start codon is boxed. Asterisks indicate the number of times a particular base was identified as the transcriptional start site. Putative −10 and −35 regions are highlighted by a broken box. The −41 bp and −42 bp start sites are highlighted together as it is not possible to distinguish between these sites more specifically (see text).

