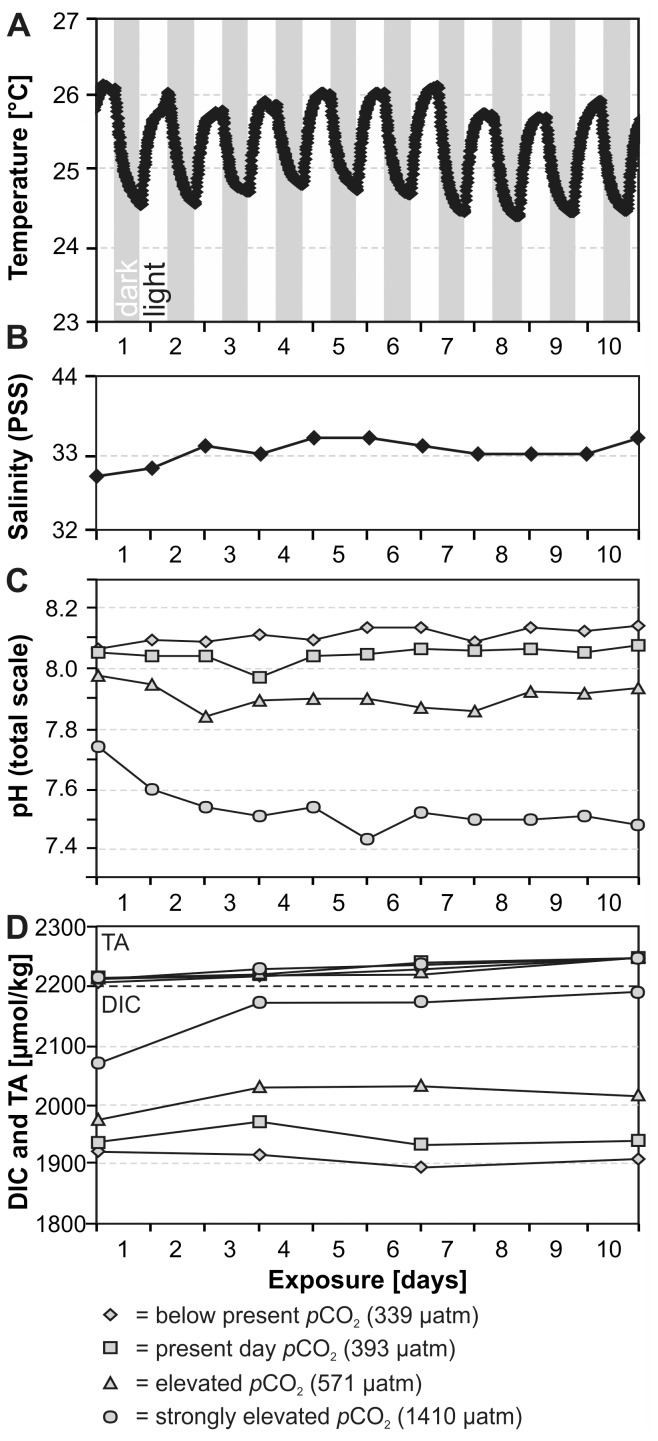
Figure 3. Temporal variability of measured experimental settings and carbonate system parameters during the 10 day experiment.
(A) Diurnal temperature oscillation as a function of heat radiation during the illumination phases; identical for all four treatments. (B) Salinity of the incoming seawater; identical for all four treatments. (C) Measured pH levels; for monitoring purposes only. (D) TA (top) and DIC (bottom).

