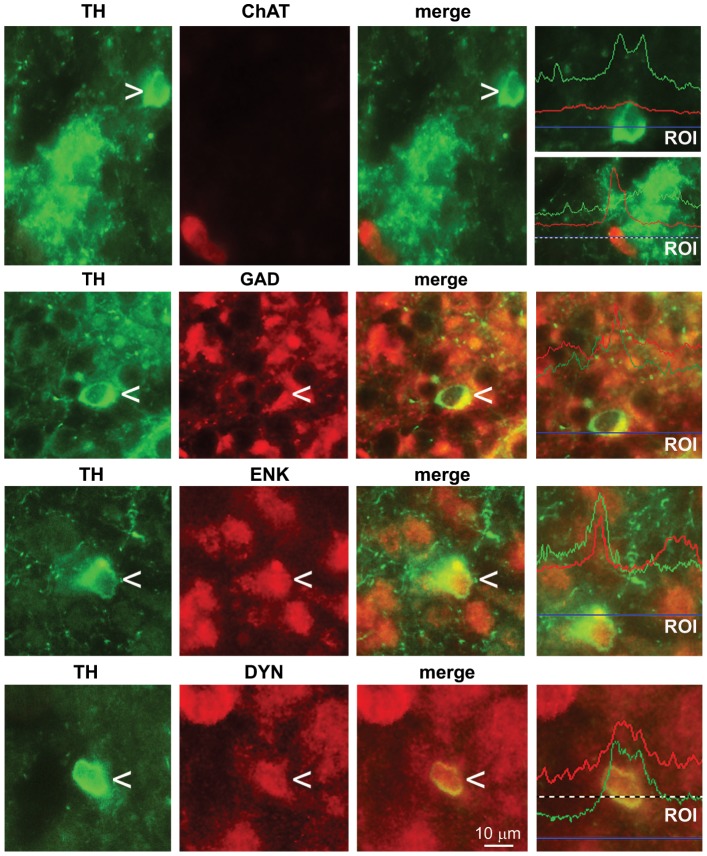
Figure 2. Double fluorescence staining for TH and ChAT, GAD, ENK or DYN.
Co-localization was examined by densitometric analysis of red and green fluorescence in a selected region corresponding to the horizontal line in the right panels. The coincidence of the fluorescence peaks is indicative of a high level of co-localization.

