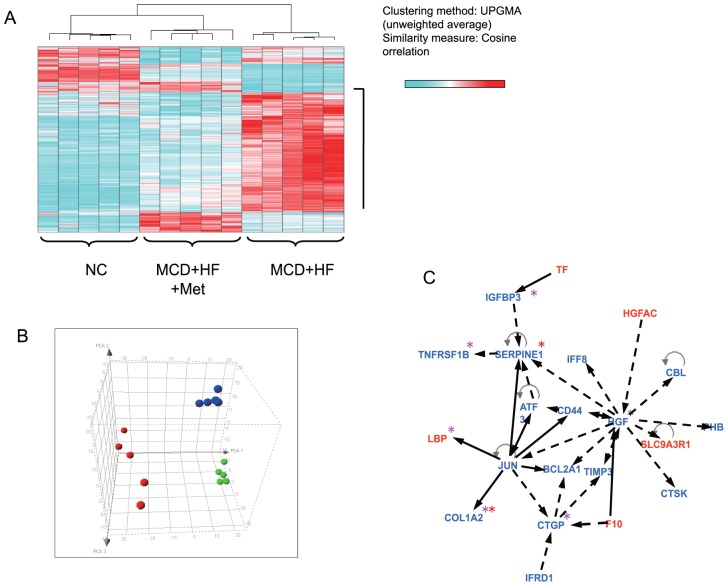
Figure 3. Comprehensive gene expression analyses in livers of mice treated with metformin.
(A) Gene expression profile analysis using materials from individual animals and performed unsupervised hierarchical clustering of all sets of expression data with the 792 genes. The results clearly showed that mice that had been treated with metformin were clustered together with normal chow and could be separated from no treatment. (B) Principal component analysis using the same 792 genes dataset showed a remarkable shift in the distribution of mice treated with metformin compared with no treatment. Green, normal chow group; Red, the methionine- and chorine-deficient (MCD) diet+high fatgroup; Blue, the MCD+HF diet mixed with 0.1% metformin group. (C) Gene-to-gene network analysis was used to investigate molecular relationships between differentially expressed genes included in Hepatic Fibrosis/Hepatic Stellate Cell Activation pathway. Red asterisk (*): NASH related genes. Pink asterisk (*): hepatic fibrosis related genes. Red: genes up-reguleted by metformin treatment. Blue: genes down-regulated by metformin treatment.

