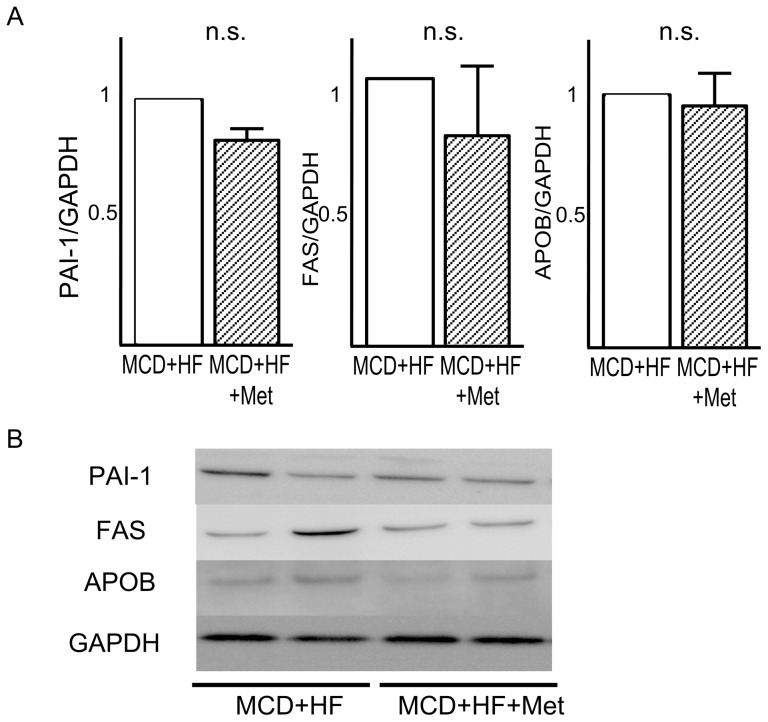
Figure 8. Effects of metformin on the levels of proteins involved in lipid metabolism in the liver of mice with the advanced stages of nonalcoholic steatohepatitis.
(A) Quantitative data from densitometric analysis of Western blots from three samples. (B) Representative blots for PAI-1, FAS, and, APOB are shown. GAPDH is used as a control for protein loading. Values are the mean ± standard error. *p<0.05 versus the MCD+HF diet group.

