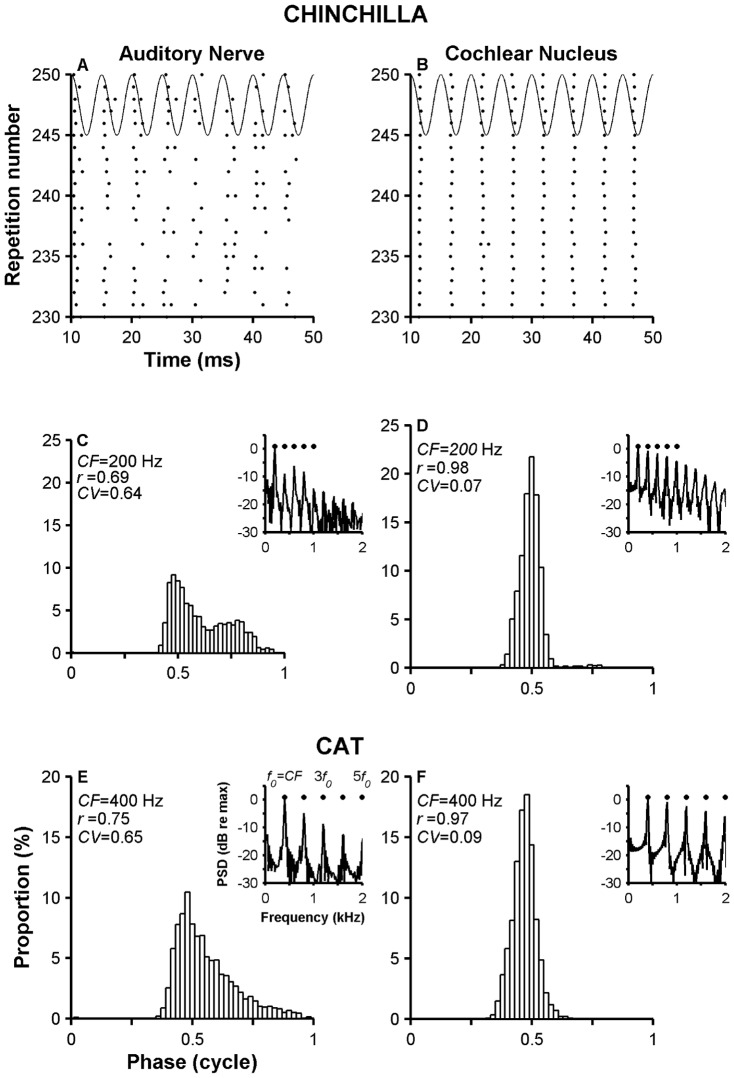
Figure 1. Enhancement of synchrony and rate relative to auditory nerve in chinchilla and cat.
Panels A and B display dot raster plots for the responses of an auditory nerve fiber and a cochlear nucleus neuron, respectively, in chinchilla. Only the neural responses obtained in the last 20 stimulus presentations are shown. Stimulus waveforms with an arbitrary phase are superimposed on panels A and B (continuous traces). Panels C and D contain period histograms obtained from responses to CF tones of the ANF and the VCN neuron, respectively. Panels E and F display period histograms obtained from responses of one ANF and one VCN neuron, respectively, in cat. Power spectrum densities (PSDs) of the responses shown in A and B are displayed in the insets C and D, respectively. The first dot in every inset is placed at the frequency corresponding to CF ( = f 0). Period histograms were shifted to make their maximum value occur at 0.5.

