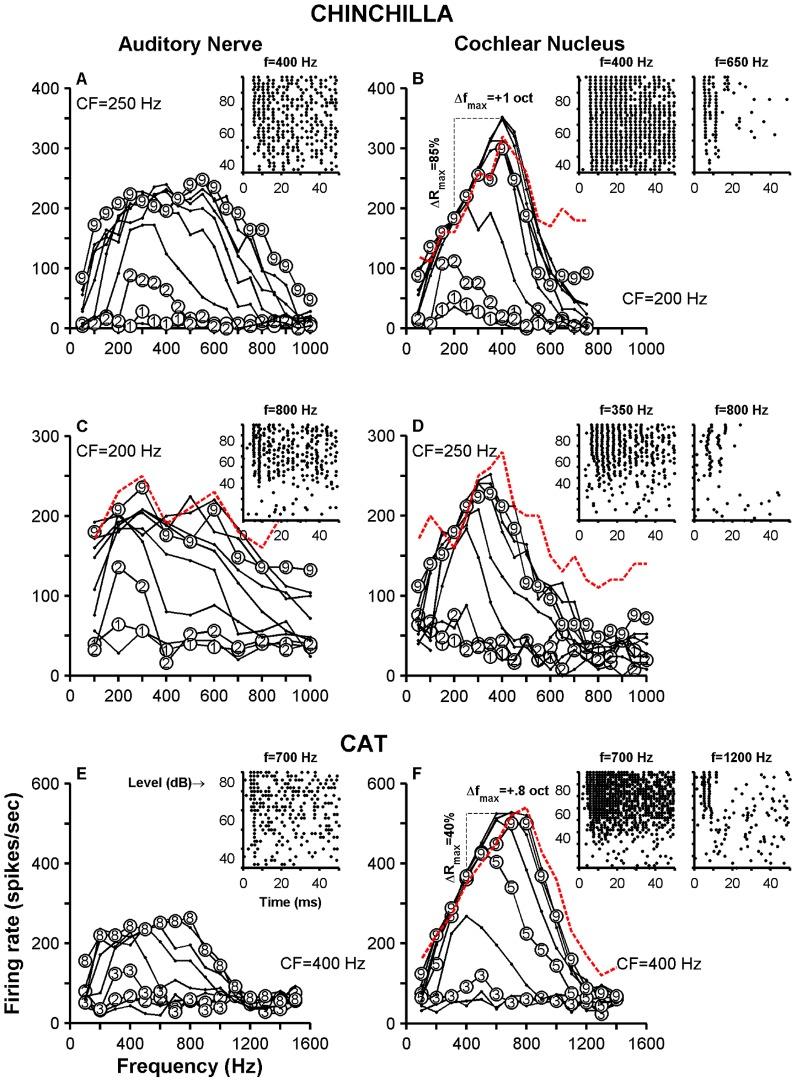
Figure 2. Receptive field maps of ANFs and VCN neurons.
Top two rows display iso-intensity curves collected in chinchillas. Panels E and F show iso-intensity curves measured in cats. Data from ANFs are in panels A, C and E. VCN units data are in panels B, D and F. Stimulus levels are indicated in some of the curves (e.g., 1 = 10 dB SPL; 4 = 40 dB SPL). Insets in every panel show dot raster plots at several stimulus levels (5 repetitions per level) indicated in the ordinates. Stimulus frequencies are indicated above each dot raster plot. Firing rates, except for those indicated by the red dashed lines, were measured during the stimulus duration (0–50 ms). Red dashed lines represent firing rate evoked by 90-dB tones during the first 20 ms of the response.

