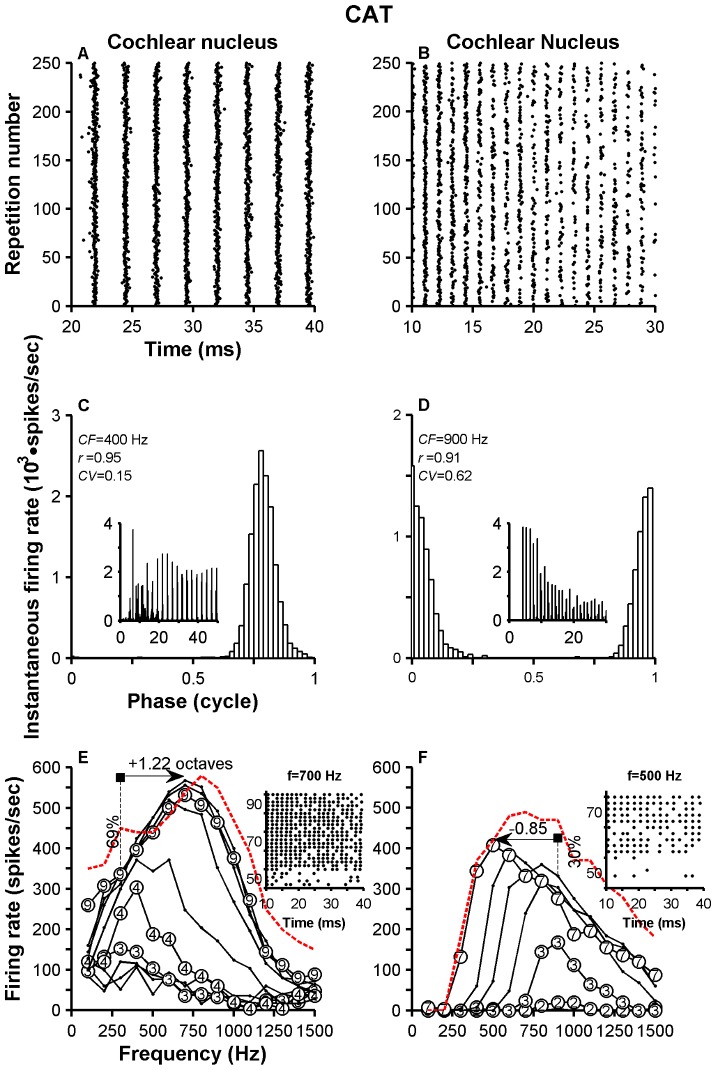
Figure 4. Single tone responses of two cat high-sync neurons.
Data from two cat VCN neurons shown in a similar fashion to Fig. 2. Stimulus frequency used to evoke data in panels A and B are 400 and 900 Hz, respectively. Firing rates, except for those indicated by the red dashed lines, were measured during the stimulus duration (0–50 ms). Red dashed lines represent onset firing rates evoked by 90-dB tones, except in panel F (70 dB SPL).

