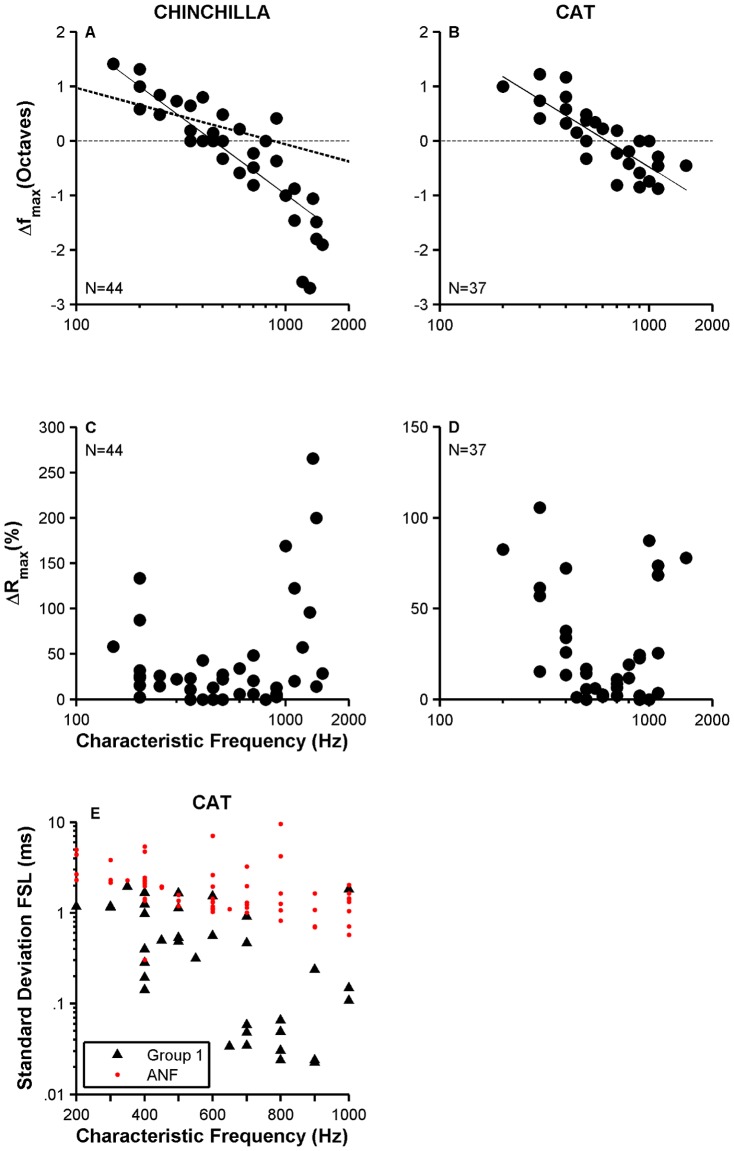
Figure 6. Analysis of receptive field properties and first-spike latencies.
Panels A and B illustrate scatter plots of Δfmax-vs.-CF functions for chinchilla and cat VCN neurons, respectively. Straight continuous lines display a linear fit to the data. Thick dashed line in panel A represents a fit to similar chinchilla ANF data [9]. ΔRmax-vs.-CF curves for chinchilla and cat neurons are displayed in C and D, respectively. Number of neurons (N) is indicated in each panel. A scatter plot of σFSL as a function of CF for ANFs (red dots) and high-sync neurons (filled triangles) in cat is in panel E.

