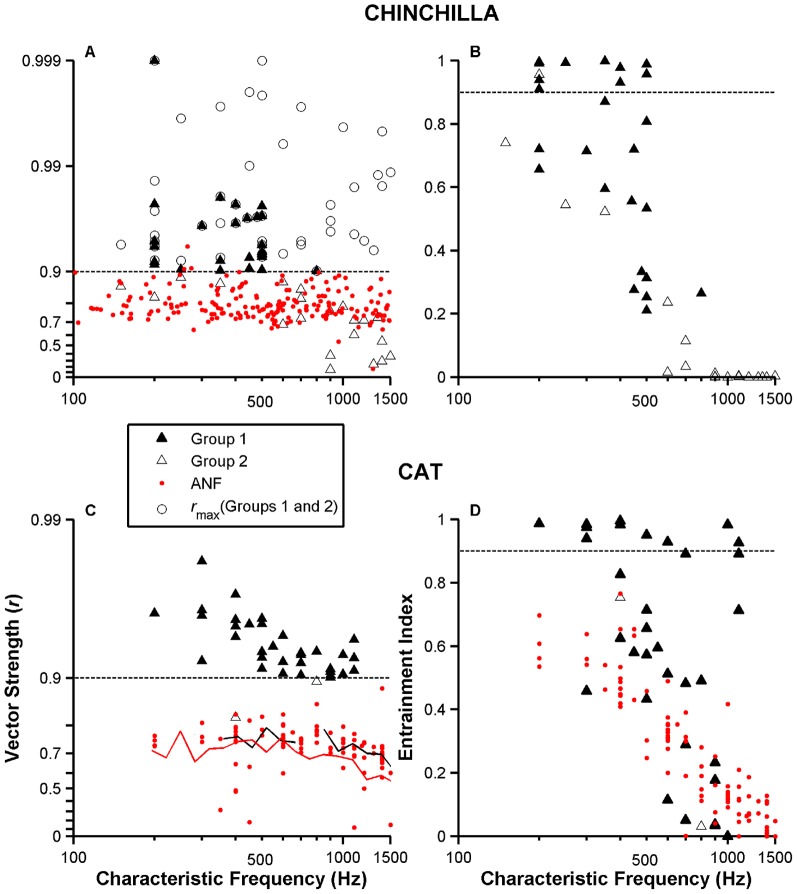
Figure 7. Enhancement of vector strength and entrainment in VCN neurons' discharges relative to ANFs'.
Filled triangles in panels A and B denote vector strength values and entrainment indices, respectively, obtained from responses to 60-dB SPL tones at CF of a population (N = 26) of high-sync neurons (i.e., Group 1) in chinchillas. Similar results are in panels C and D for a population (N = 34) of cat high-sync neurons. Black and red continuous lines in panel C represent average vector strength values for ANFs in cats and chinchillas, respectively. Results of the same temporal analysis performed on Group 2 neurons are shown using open triangles in panels A–D (N = 21 in chinchillas; N = 2 in cats). Open circles in A represent r maxvalues for high-sync and Group 2 neurons (see text). Red dots in panels A and C show r max data for a population of chinchilla (N = 207) and cat (N = 63) ANFs. Red dots in panel D represent entrainment indices for ANFs.

