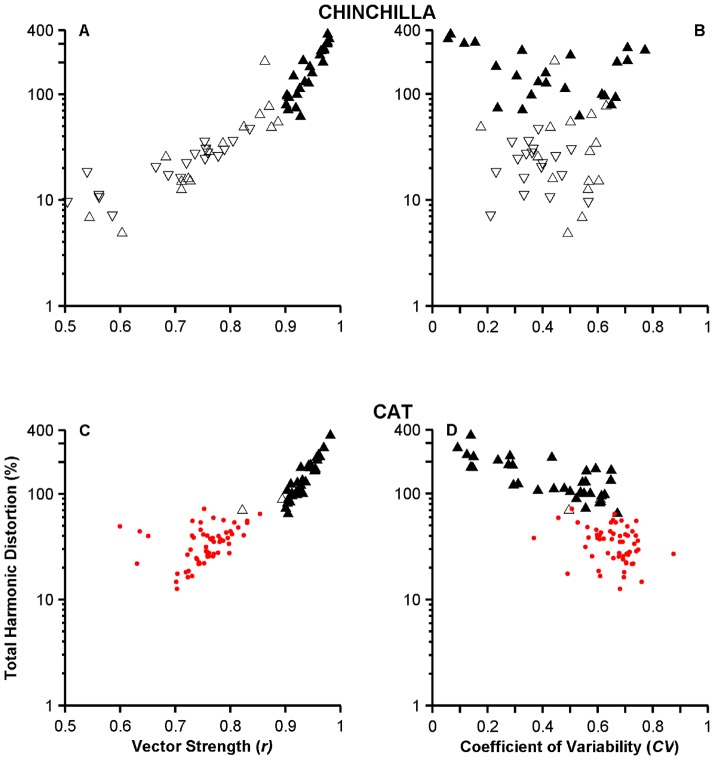
Figure 8. Distortion as a function of synchrony and interspike interval variability.
Black filled (N = 26 and 34 in chinchillas and cats, respectively) and open “up” triangles (N = 16 and 2 in chinchillas and cats, respectively) represent data from high-sync and Group 2 VCN neurons, respectively. “Down” triangles represent data from Group 3 VCN neurons (N = 18). Red dots show cat ANF data (N = 59). Data from chinchillas are in panels A and B, and from cats in panels C and D.

