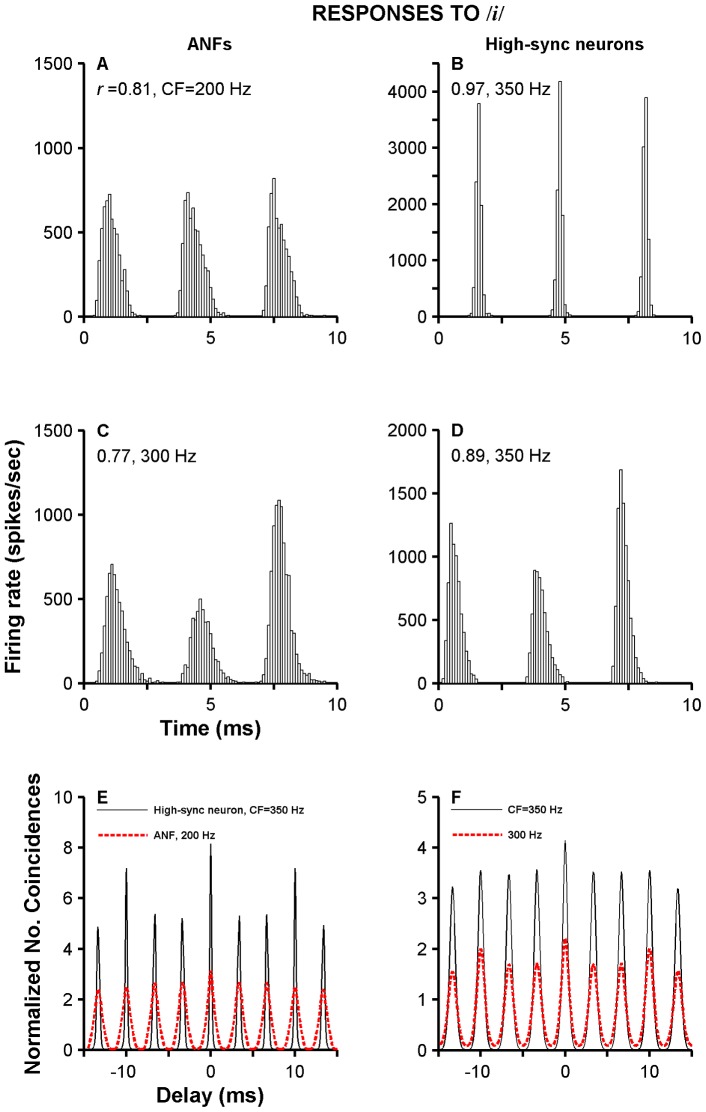
Figure 9. Responses to synthetic vowel sounds.
Panels A and C exhibit period histograms obtained from ANF responses to the /i/ sound. Responses of two high-sync neurons to the same stimulus are shown in panels B and D. r values indicate strength of phase locking to f 0 ( = 100 Hz). Panels E and F contrast SACs computed from high-sync neurons' (thin lines) and ANFs' (red thick lines) responses to /i/. Spike trains used to compute SACs in panel D are the ones used in panels A and B. Similarly, SACs in E and F were computed from response whose histograms appear in panels C and D.

