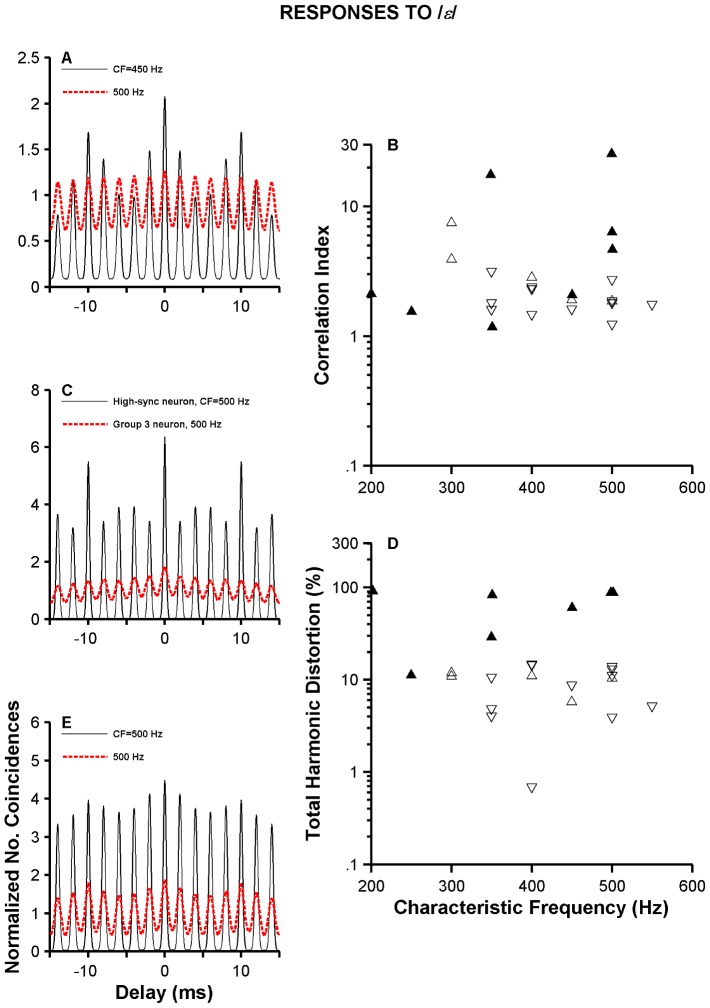
Figure 11. Normalized SACs and harmonic distortion of VCN neurons' responses to /ε/.
Panels in A, C and E contain normalized SACs constructed from high-sync neurons (thin lines) and Group 3 neurons (red thick lines) responses to /ε/. High-sync neurons in A, C and E are the same neurons whose histograms are shown in Figs. 10A–10C, respectively. Group 3 neurons in panel A, C and E are the same as in Figs. 10–10C. Panel B displays a scatter plot of CIs as a function of CF for high-sync (filled triangles, N = 13), Group 2 (open triangles, N = 6) and Group 3 VCN neurons (inverted triangles, N = 13). Panel C displays THDs for the same neurons in panel B.

