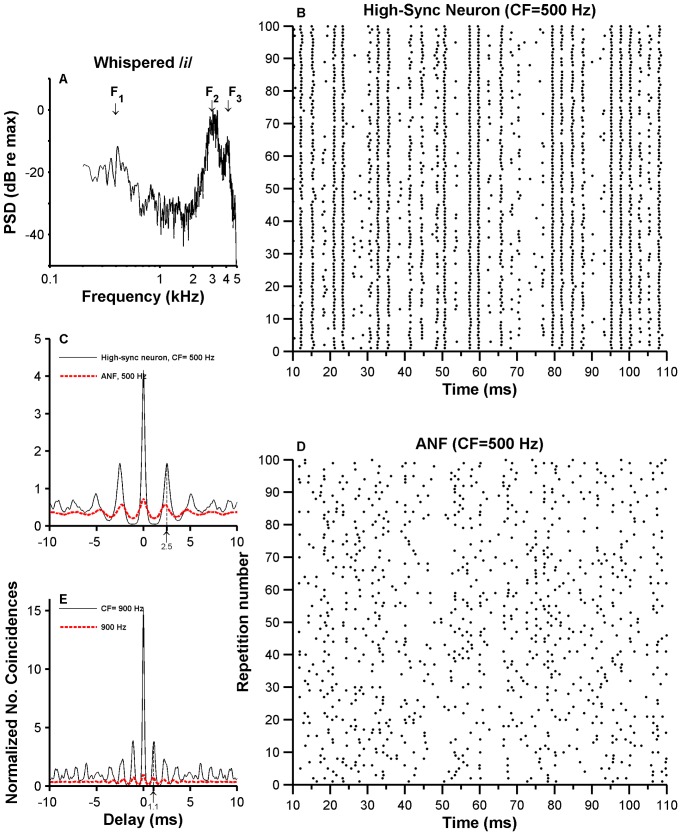
Figure 12. Responses of high-sync neurons and ANFs to the whispered /i/ sound.
Panel A display the result of the PSD analysis of the whispered / i / vowel. F1, F2 and F3 represent the approximate location of the respective formants. Panels B and D show dot raster plots of the responses of a high-sync neuron and an ANF, respectively. SACs obtained from responses in B and C are shown in panel C (thin line: high-sync neuron; red thick line: ANF). SACs in panel E were obtained from data from another high-sync/ANF pair, with same CF ( = 900 Hz).

