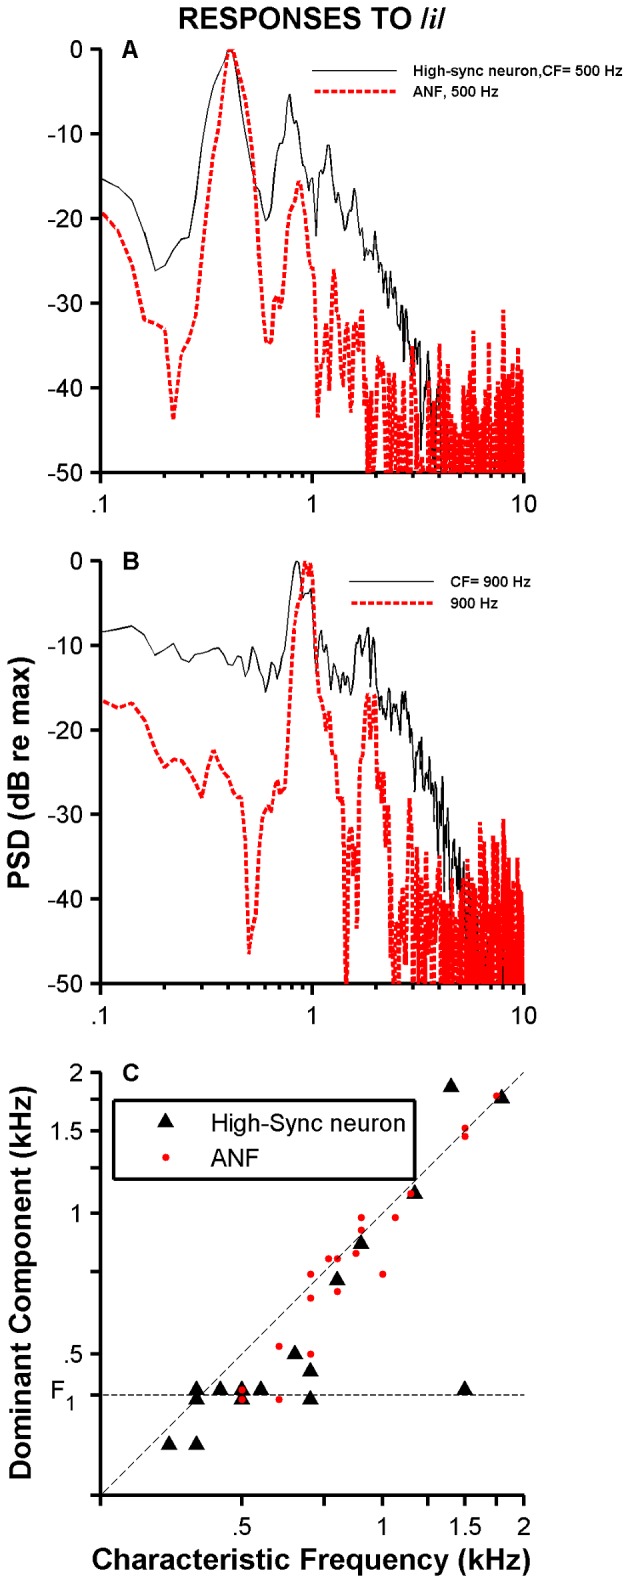
Figure 13. PSD and dominant-component analyses of SACs.

Panels A and B show Fourier transform amplitude of SACs displayed on Figs. 12C and 12 E, respectively, using the same color convention. Panel C exhibits a scatter plot of the frequencies of dominant components as a function of CF for a population of high-sync neurons (N = 19) and ANFs (N = 24).
