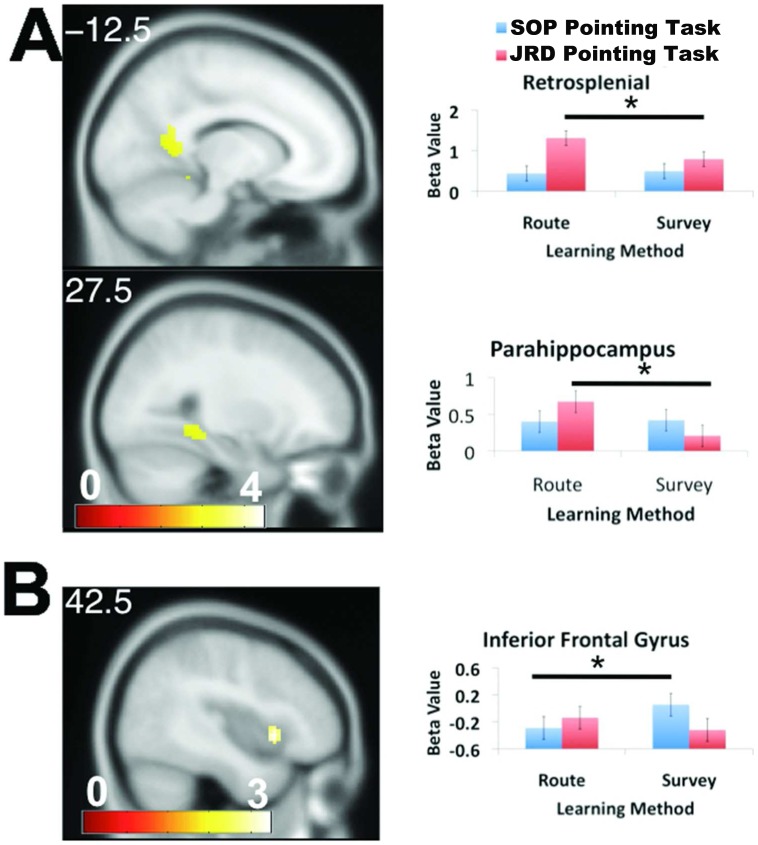
Figure 2. Brain regions showing differential activation following route ("route") vs. cartographic map learning ("survey") during the SOP vs. JRD tasks.
A) Retrosplenial cortex ([14–52 12], z = 3.98) and parahippocampal cortex ([−26 −40 −12]) showed greater activation for the route > map contrast during the JRD but not SOP task. B) Inferior frontal gyrus [40 13 −2], z = 3.37) showed greater activation for the map> route contrast during the SOP but not JRD task.

