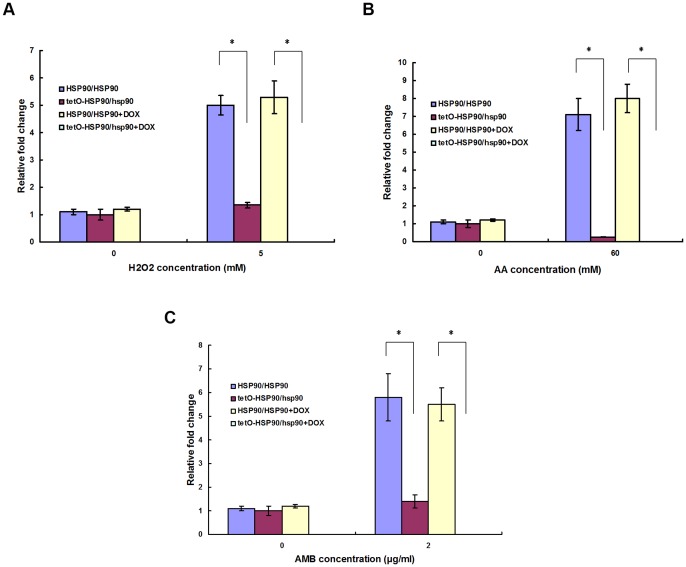
Figure 1. HSP90 expression after apoptotic stimulus treatment.
C. albicans cells were treated with or without apoptotic stimuli for 3 h in the absence or presence of 20 μg/ml DOX. (A) Cells treated with H2O2. (B) Cells treated with AA. (C) Cells treated with AMB. Transcriptional level of HSP90 was detected through real-time RT-PCR and normalized on the basis of the 18S level. Data are shown as mean ± SD from three independent experiments.

