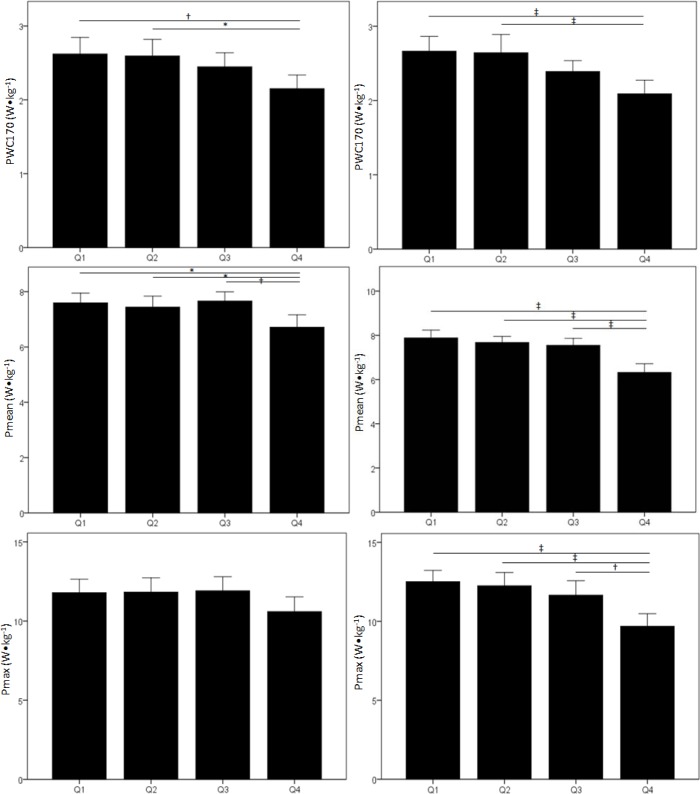
Fig. 2.
Physical working capacity in heart rate 170 beats*min−1 (P170; upper row), mean power during the Wingate anaerobic test (Pmean; middle row) and maximal power estimated by a Force-velocity test (Pmax; lower row) for quartiles (Q1, Q2, Q3 and Q4) of body mass index (left) and body fat percent (right).
*P<0.05, † P<0.01, ‡ P <0.001.

