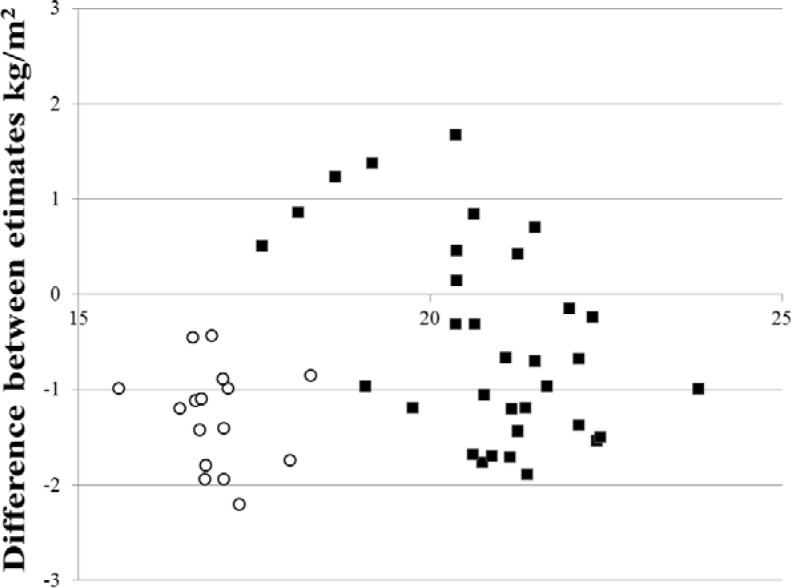
Fig. 1.
Differences in fat free mass index between the bioelectrical impedance analysis (BIA) and the dual energy X-ray absorptiometry (DEXA) were plotted against their group mean ((BIA mean+DEXA mean)/2) to determine the directional bias of the BIA estimate compared to the DEXA. Black filled in squares represent male values and black circles represent female values.

