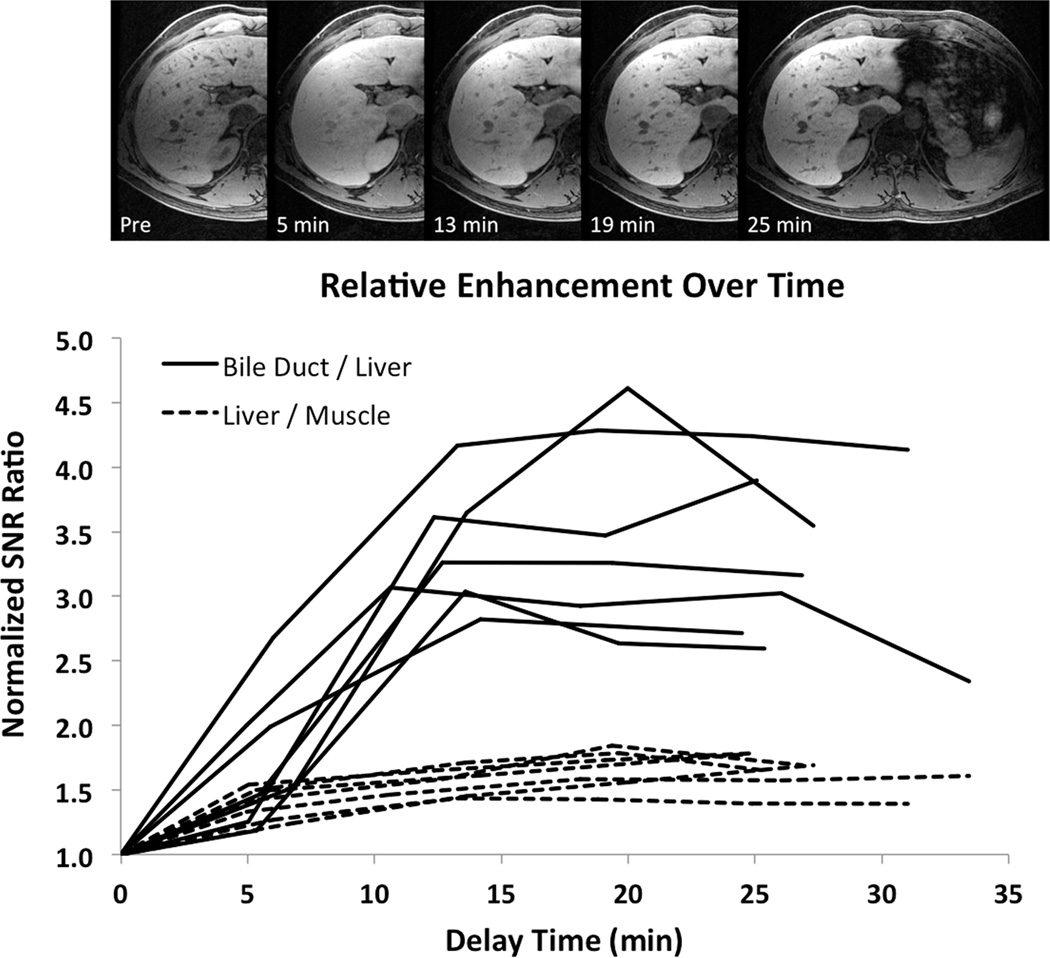
Figure 2. Delay Time Optimization.
Images show the uptake of gadoxetic acid over time in one of the 8 healthy subjects, obtained using the 3D high-resolution T1-weighted navigated 3D-SPGR sequence. The plot shows the relative SNR ratios of bile ducts and muscle compared with liver for all 7/8 (88%) of the technically adequate studies. While the liver signal increases by a factor of 1.5 compared with muscle over 10–25 min following injection, the signal in the bile ducts increases by a factor of 2.5–4.5, peaking between 15–25 min.

