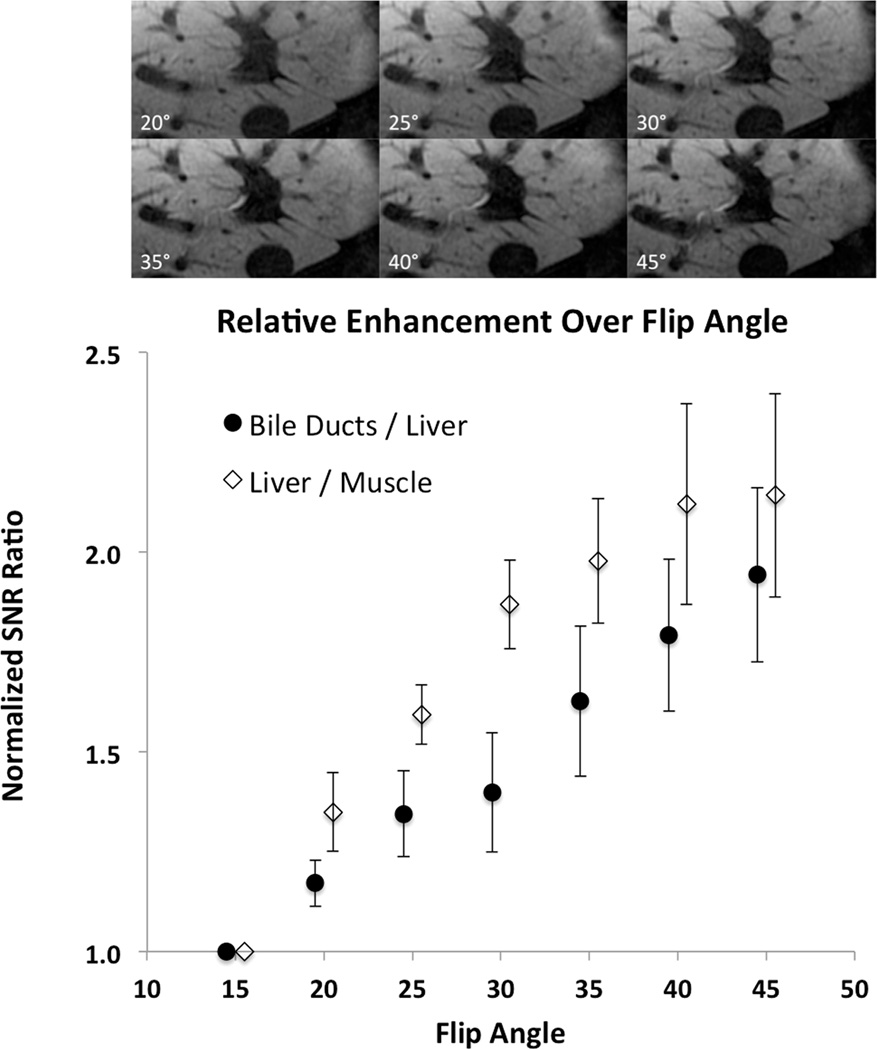
Figure 3. Flip Angle Optimization.
Images obtained by varying the flip angle in the same healthy subject as shown in Figure 2. The plot of SNR ratios shows statistically significant monotonic increases as a function of flip angle. This results in increased contrast between liver and both bile ducts and non-hepatocyte origin intrahepatic tumors such as cholangiocarcinoma. Because the increase in the SNR ratios between 40° and 45° degrees was not statistically significant, a 40° flip angle was chosen for the optimized clinical protocol in order to avoid any potential SAR issues.

