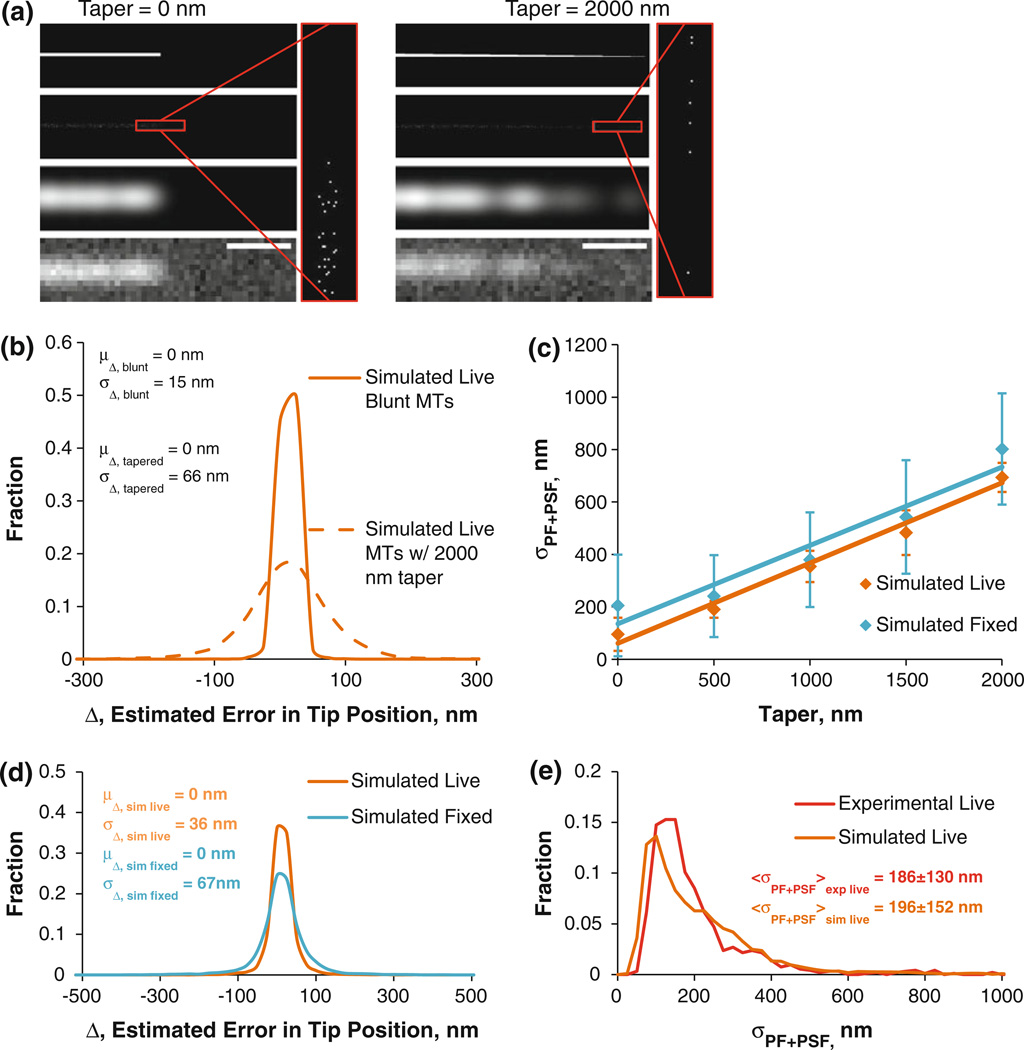
FIGURE 2. Simulation of blunt and tapered MTs and estimated accuracy in tracking.
(a) Leftmost panels: steps in simulating a blunt MT; top left: starting unspeckled blunt MT; upper middle left: speckled MT tip (red inset enlarges the tip); lower middle left: model-convolved speckled MT tip; bottom left: final image of speckled blunt MT tip coarse-grained to match the microscope setup with the noise levels resembling experimental values. Rightmost panels: same as in leftmost panels, except for a tapered MT tip. Scale bars = 500 nm. (b) A histogram of tip tracking accuracy of blunt and tapered MT tips given by the histogram of errors in tip tracking. (c) Plots of σPF+PSF vs. simulated MT taper, used to convert σPF+PSF values into taper lengths and vice versa. (d) Accuracy in MT tip tracking with simulated live/fixed cell taper distributions. (e) Tip structure distribution, as measured by the σPF+PSF distributions of experimental (red) and simulated (burnt orange) live cell MTs.

