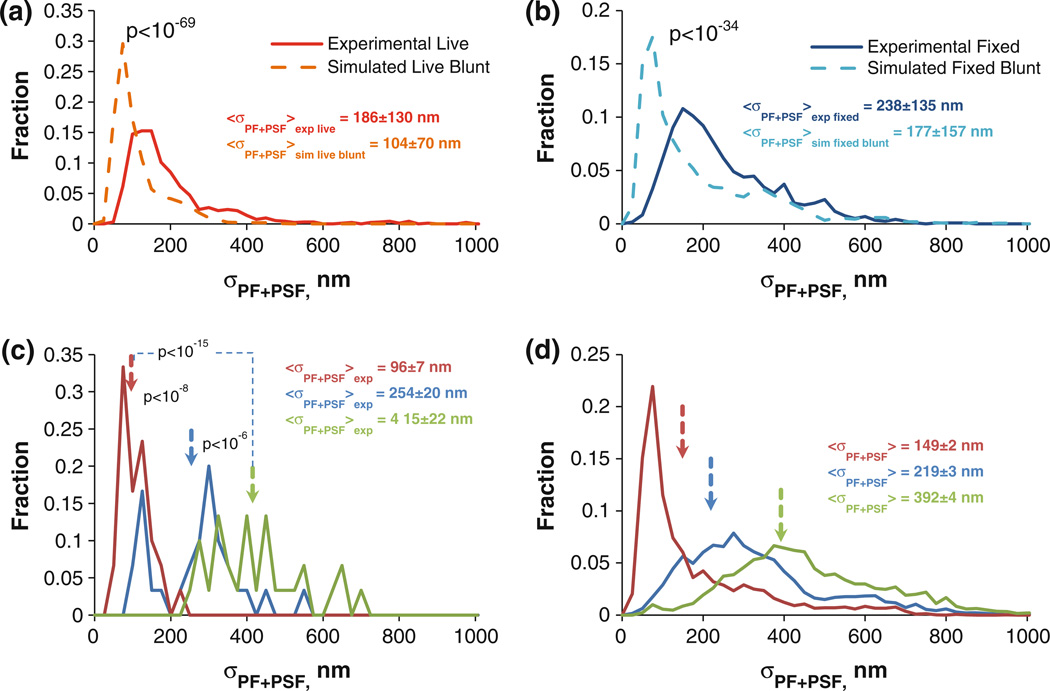
FIGURE 4. Determining MT taper and protofilament length variability.
(a) σPF+PSF distributions from live cell MTs (red) and blunt simulated live cell MTs (burnt orange). Uncertainties indicate the sample standard deviation of the distribution (Nexp. live = 930, Nsim. live blunt = 10230). (b) Same as a, except for fixed MTs (Uexp. fixed = 1185, Nsim. fixed blunt = 3000). (c) σPF+PSF distribution from three different experimental fixed MTs. (Uncertainties are 6SEM, N = 30). (d) σPF+PSF distributions of three simulated fixed cell MTs with N = 3000 for each distribution. The mean tapers from the three experimental MTs in (c) were used to generate the three distributions.

