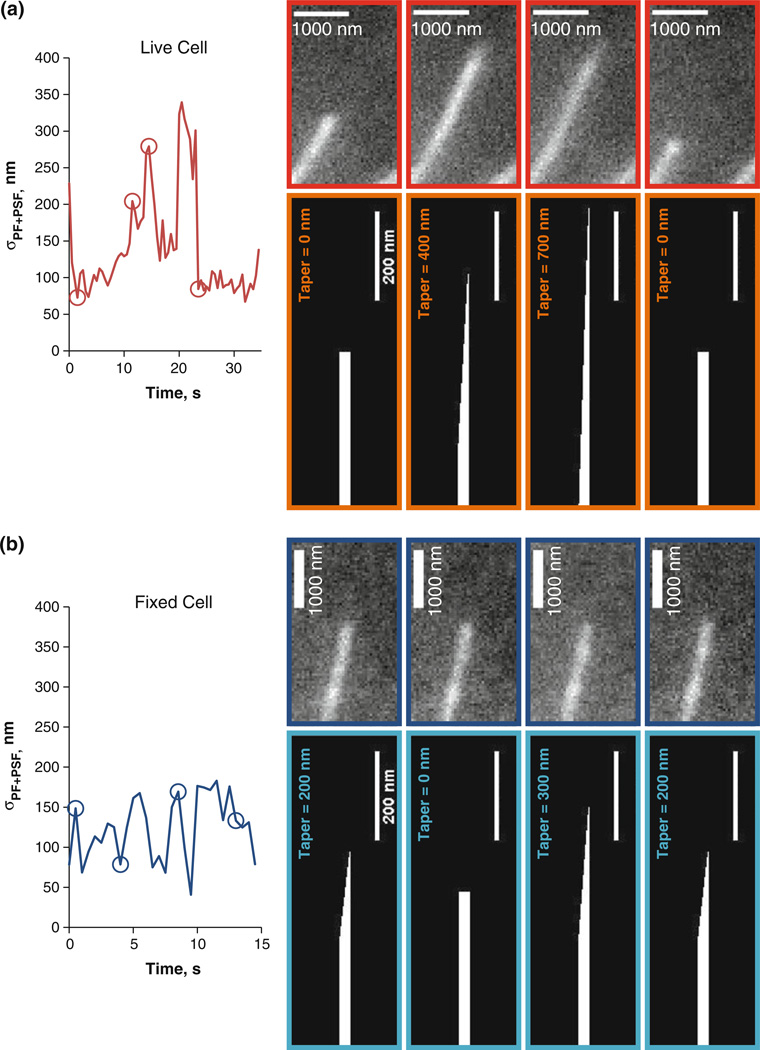
FIGURE 5. MT Tip Structure Dynamics.
(a) Left plot: Time series of σPF+PSF for a single live cell MT. Panels outlined in red show the MT tip at four different times, denoted by red circles on the plot to the left. The panels in burnt orange show predicted MT tip tapers at those four time points. (b) Same as (a), except for a fixed MT.

