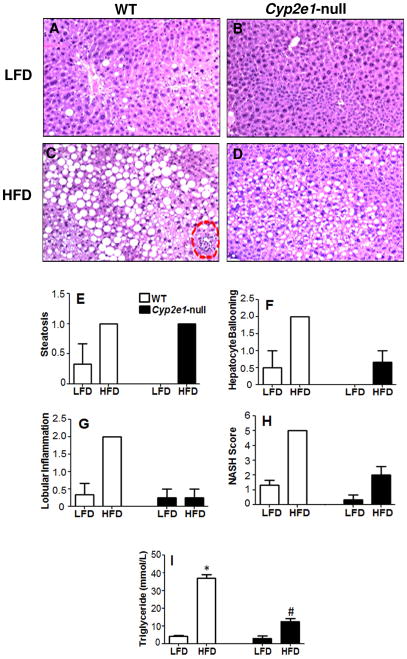
Fig. 1. Effects of LFD or HFD on hepatic steatosis and inflammation.
Photomicrographs (200×) following H&E staining from the indicated mouse livers are presented: (A) WT fed LFD, (B) Cyp2e1-null fed LFD, (C) WT fed HFD (necro-inflammatory foci shown with circular broken lines) (D) Cyp2e1-null fed HFD. Individual scores of hepatic steatosis (E), hepatocyte ballooning (F), lobular inflammation (G), NAFLD histological scoring system (H), and hepatic triglyceride levels (I) were tabulated for all four groups where WT-fed HFD was the only group to achieve a NAS of 5.

