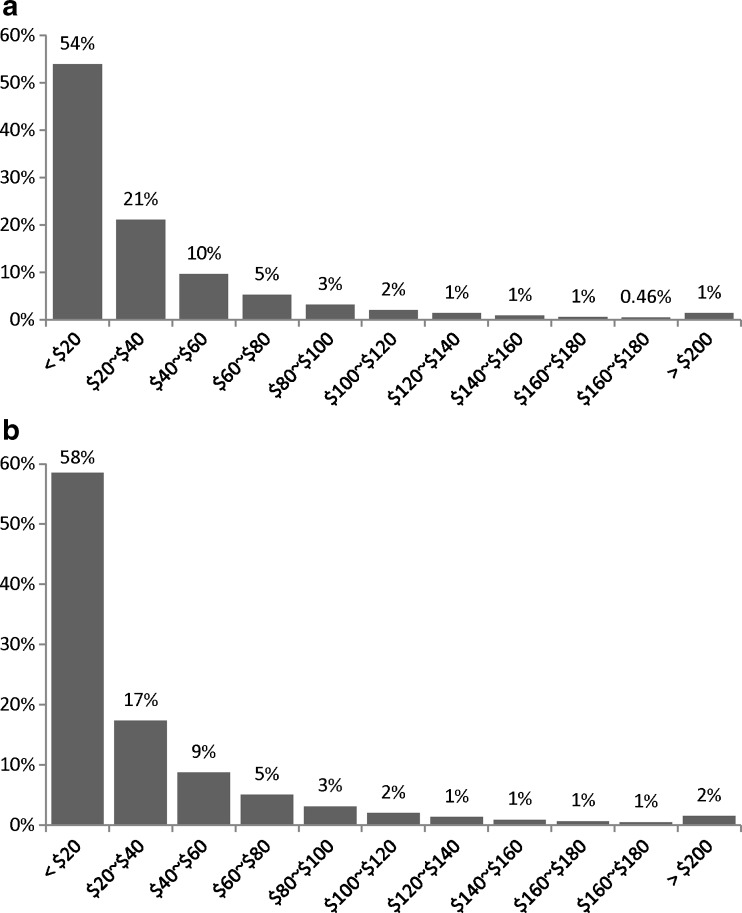
Figure 2.
Distribution of potential annual savings from switching to $4 programs among potential users. Panel A. Potential gross savings without incorporating the travelling costs among all non-users (n = 203,116). Panel B. Potential net savings after incorporating the travelling costs among those with positive net savings (n = 108,058).

