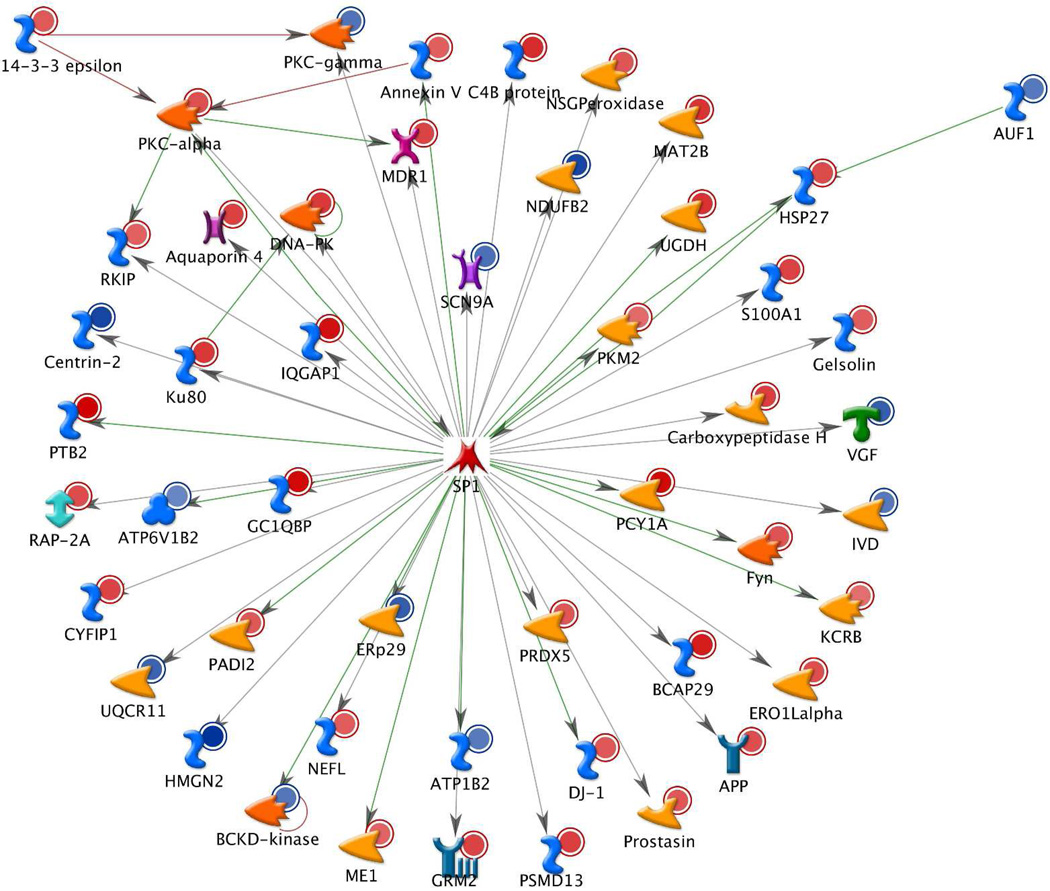
Figure 5.
The top significant transcription regulation network involving 49 out of 197 significantly differentially abundant proteins (AD versus control) determined in this study. Red circles – over-abundant proteins, blue circles - under-abundant proteins. Network map is generated with Build Network tool (option Transcription Regulation) of MetaCore 6.4 (GeneGo, Inc). See legend in Suppl . Fig. 2 for complete list of symbols. See Suppl. Report 1 for 19 more transcription networks regulating 197 differentially abundant proteins.

