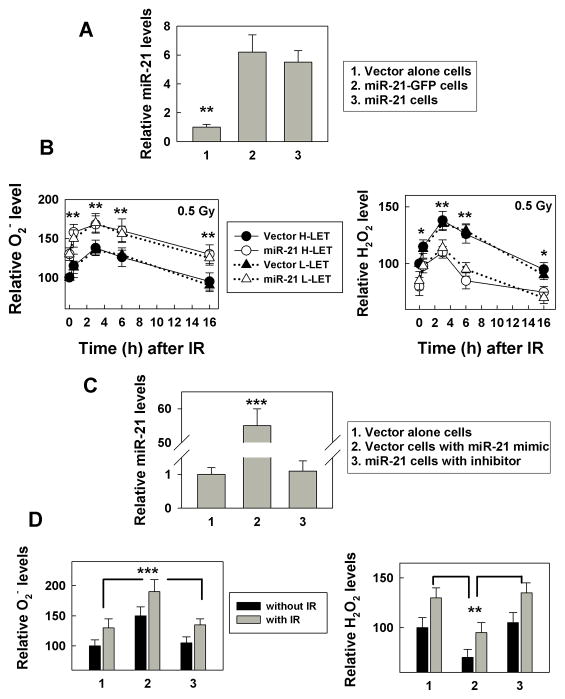
Figure 1.
miR-21 over-expression increases basal and IR-induced ROS level. A, MiR-21 levels were measured in the cells with or without stable miR-21 overexpression using a real time PCR assay. The relative miR-21 levels are expressed as a ratio of the miR-21 level in mimic transfected cells over the vector transfected control cells, **, p< 0.01. B, The ROS level (left panel: superoxide (O2−); right panel: hydrogen peroxide (H2O2)) was measured in cells with or without stable miR-21 overexpression at the indicated time after exposure to 0.5 Gy high- or low-LET IR using a flow cytometer. The results are expressed as a percentage of the level in non-irradiated control cells and are the mean ± SE obtained from two separate experiments, *: p< 0.05, **: p< 0.01. C, MiR-21 levels were measured using the cells transfected with the miR-21 mimic, inhibitor or control RNA (50 nM) at 48 h after transfection with a real time PCR assay, ***, p< 0.001. D, The ROS level (left panel: O2−; right panel: H2O2) was measured at 3 h after exposure the cells (at 48 h after transfected with miR-21 mimic, inhibitor or control RNA) to 0.5 Gy low-LET IR by flow cytometry as described in Materials and Methods. Numbers 1, 2 and 3 reflect the data from the same cells as described in C. The data are the mean ± SE and obtained from three separated experiments, **: p< 0.01; ***: p< 0.001.

