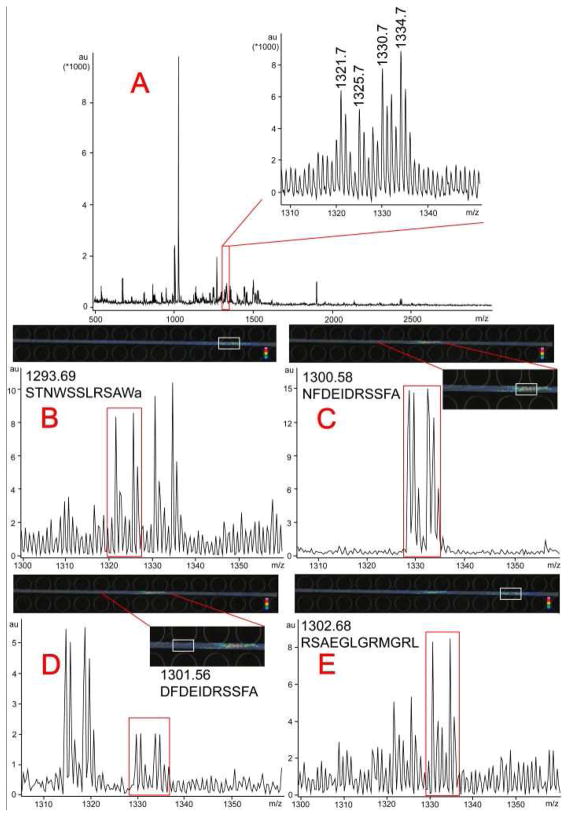
Figure 5. PACE-MSI analysis of mass range M/Z 1320 to 1335 from complex neuropeptide extracts from the blue crab PO.
A: Mass spectrum of the blue crab PO extract by direct MALDI MS analysis. A zoom-in inset showed mass range 1320–1335 with peak pairs at m/z 1321.7/1325.7 and m/z 1330.7/1334.7 which were difficult to differentiate. B–E: By scanning the MS images of mass range m/z 1320 to 1335 with PACE-MSI, four neuropeptides as reflected in different image regions were observed with their corresponding mass spectra shown. They were well-separated with enhanced MS signals, and were accurately quantified with light: heavy labeled peak ratios around 1:1.

