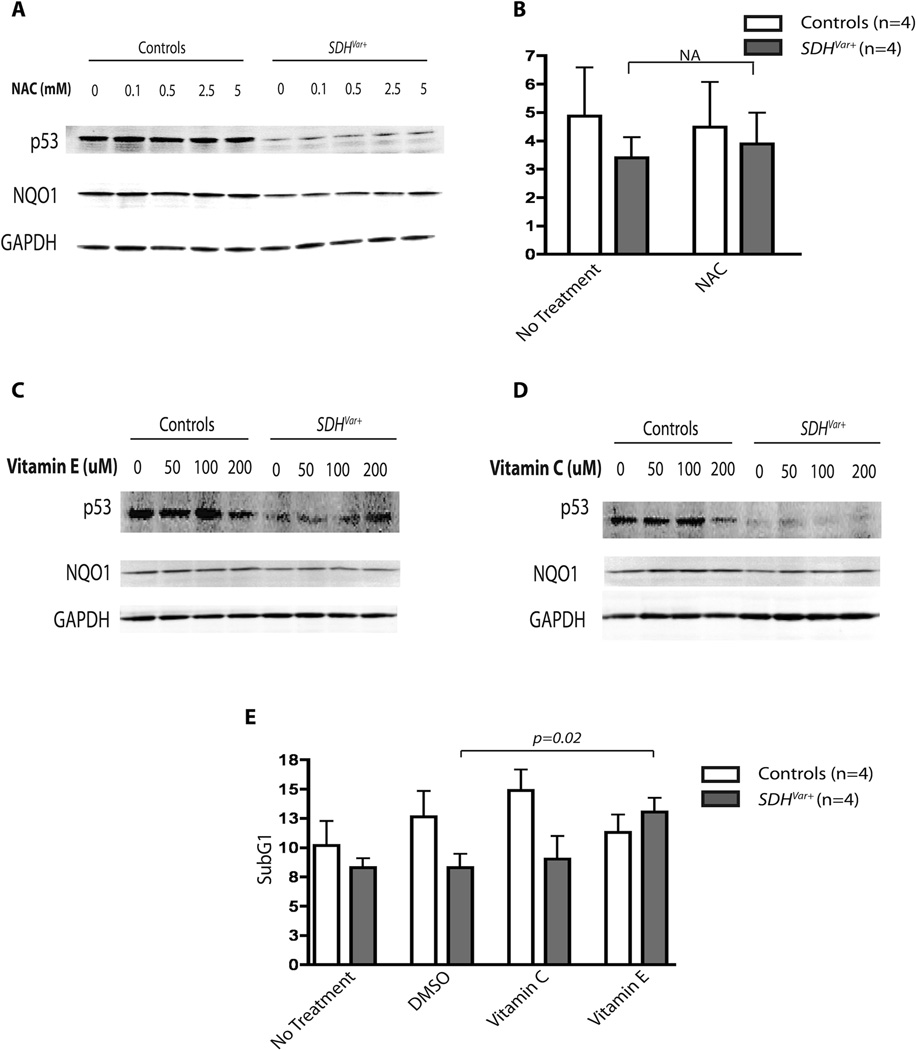
Figure 3.
Loss of p53 expression and apoptosis resistance rescued by α-tocopherol treatment. Control cell lines or SDHvar+ cell lines were treated with 0, 0.1, 0.5, 2.5 or 5 mM NAC (A) for 48 hours, and 0, 50, 100, 200 µM of vitamin E (C) or vitamin C (D) for 72 hours. Whole cell lysates were then blotted for p53, NQO1, and GAPDH as loading control. B) The comparison of percentage of cells in sub-G1 phases between control (n=4) and SDHvar+ cells (n=4) with 5µM NAC treatment for 48 hours; water mock treatment was used as control. E) The comparison of percentage of cells in sub-G1 phases between control (n=4) and SDHvar+ cells (n=4) with 100µM vitamin C or vitamin E treatment for 72 hours; DMSO mock treatment was used as control for vitamin E, and water mock treatment was used as control for vitamin C.

