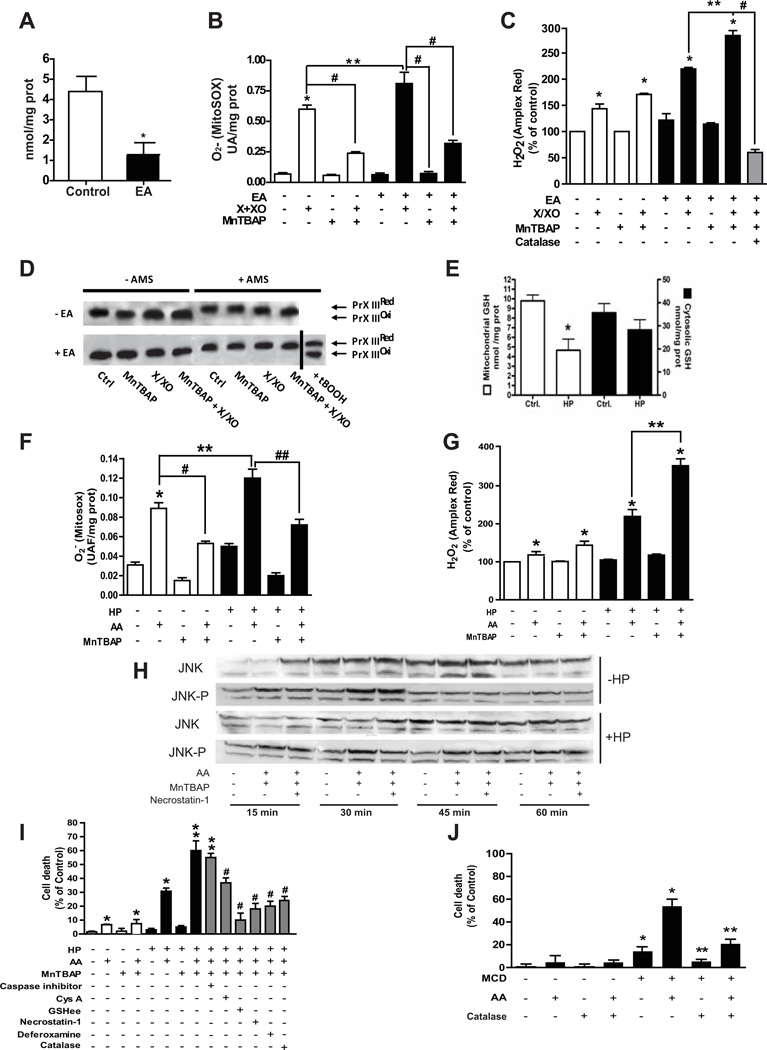
Figure 1. Effect of MnTBAP on isolated rat liver mitochondria with or without GSH depletion and sensitization of mGSH-depleted hepatocytes to SOD mimetic-induced necrotic cell death.
A, GSH levels after EA incubation; *p<0.05 vs control. B–C, ROS determination by MitoSOX and Amplex Red. Both MitoSOX and Amples Red measurements were done after 10 min of incubation; B, * p<0.05 vs. control; # p<0.05 vs X+XO; **p<0.05 vs X+XO; # p<0.05 vs EA+X+XO; C, *p<0.05 vs control; **p<0.05 vs EA+X/XO; #p<0.05 vs EA+X/XP+MnTBAP. D, redox status of Prx-III in the presence or absence of AMS. tBOOH was used as a positive control to induce the oxidation of Prx-III. Data are the mean±SD of 10–12 mitochondrial preparations. E, GSH in cytosol and mitochondria from rat hepatocytes incubated with HP. *p<0.05 vs. control. E–G, ROS determination as in Fig 1B–C following incubation with or without AA, HP or MnTBAP; B, *p<0.05 vs. control; **p<0.05 vs. AA; # p<0.05 vs. AA; ## p<0.05 vs. HP+AA; C, *p<0.05 vs. control; ** p<0.05 vs. HP+AA. H, Effect of mGSH depletion on the time-dependent JNK phosphorylation after incubation with AA, MnTBAP or necrostatin-1. A representative western blot of 6 individual experiments is shown. I, hepatocellular death determined by Trypan blue and effect of different inhibitors. *p<0.05 vs control; # p<0.05 vs. AA with or without HP; ** p<0.05 vs HP+AA; ## p<0.05 vs. HP+AA+MnTBAP. J, cell death of hepatocytes isolated from MCD-fed mice with or without exposure to AA and effect of catalase defense. *p<0.05 vs control hepatocytes; **p<0.05 vs. MCD hepatocytes. Data are the mean± SD of 12–14 individual cell preparations.

