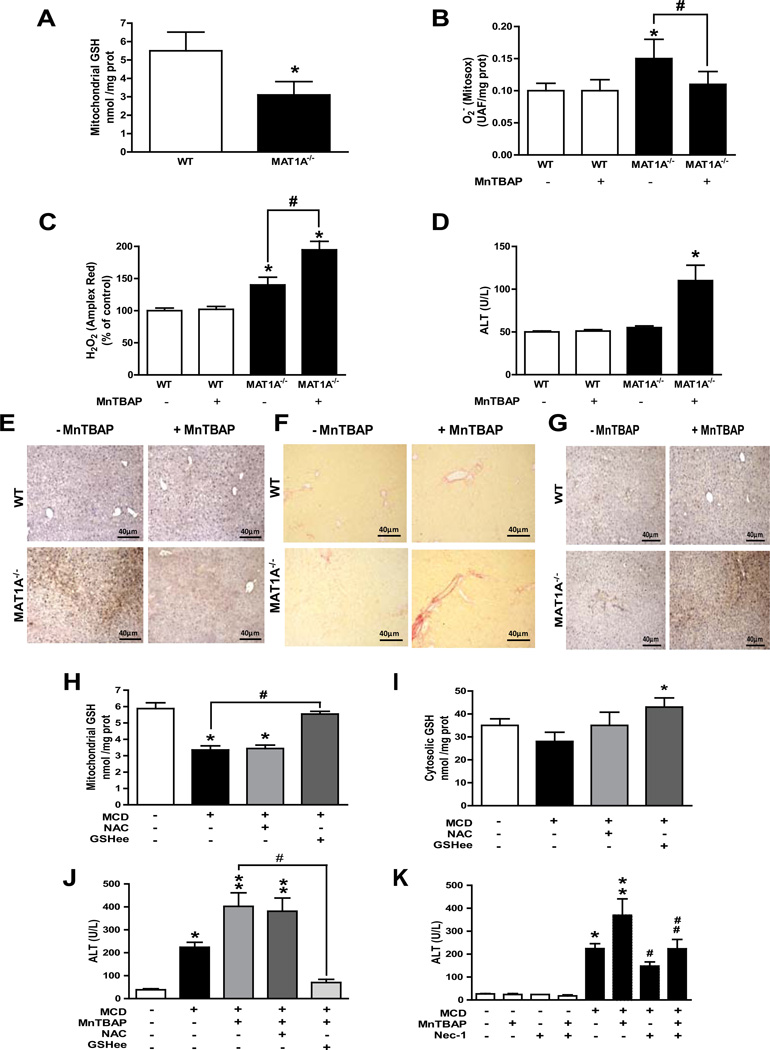
Figure 3. MnTBAP treatment in vivo increases liver injury in MAT1A knockout mice and combination therapy in MCD-fed mice.
A, liver mitochondrial GSH from wild type (WT) and MAT1A null mice. B, MitoSOX and C, Amplex Red measurement of liver samples from WT and MAT1A null mice with or without MnTBAP treatment. D, serum ALT levels in WT and MAT1A null mice with or without in vivo treatment with MnTBAP. Representative images of myeloperoxidase, MPO (E), Sirius red (F), and 3-nitrotyrosine immunoreactivity (G) of MAT1A null mice upon MnTBAP treatment. Data are representative images of experiments from 5–6 individual mice.*p<0.05 vs. WT and MAT1A null mice; #p<0.05 vs. MAT1A−/− mice. H-I, hepatic mitochondrial GSH (H) or cytosol GSH (I) from MCD-fed mice with or without in vivo treatment with NAC or GSHee; *p<0.05 vs control; #p<0.05 vs. MCD. J–K, serum ALT levels from MCD fed mice following treatment with MnTBAP, NAC, GSHee or necrostatin-1 (Nec-1) as indicated; *p<0.05 vs. control; **p<0.05 vs MCD; #p<0.05 vs. MCD+MnTBAP;##p<0.05 vs. MCD+MnTBAP. Data are the mean± SD of 4–6 individual mice.

