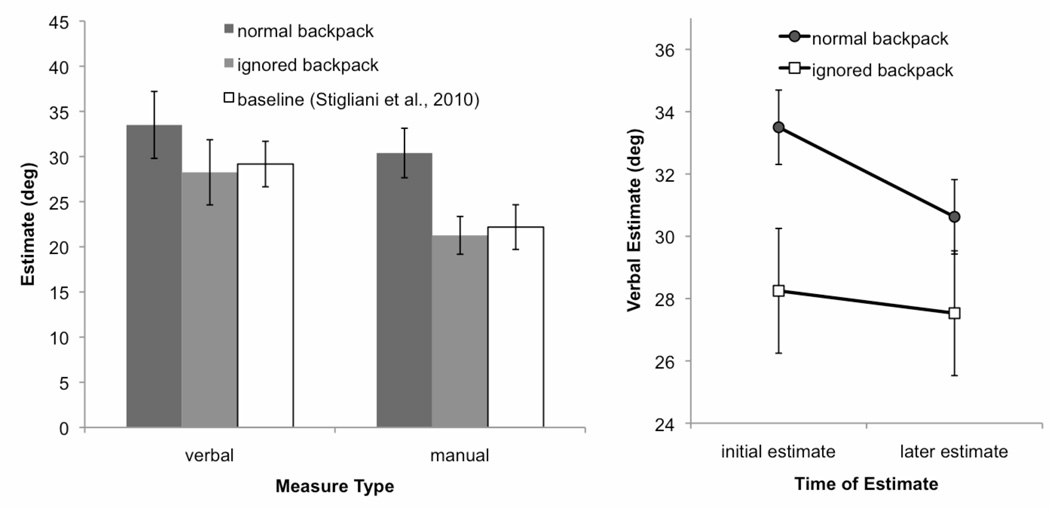
Figure 1.
Average slant estimates as a function of experimental demand and the type (left) and time (right) of measurement. The left plot shows that if participants are asked to ignore the heavy backpack, their slant estimates are not elevated relative to baseline data collected without a backpack. Standard errors of the means are shown for the left plot. The right plot shows that participants in the normal backpack condition revise their estimates downward when later asked how steep the hill actually is. Standard error bars for the right plot are computed with respect to within-subject differences.

