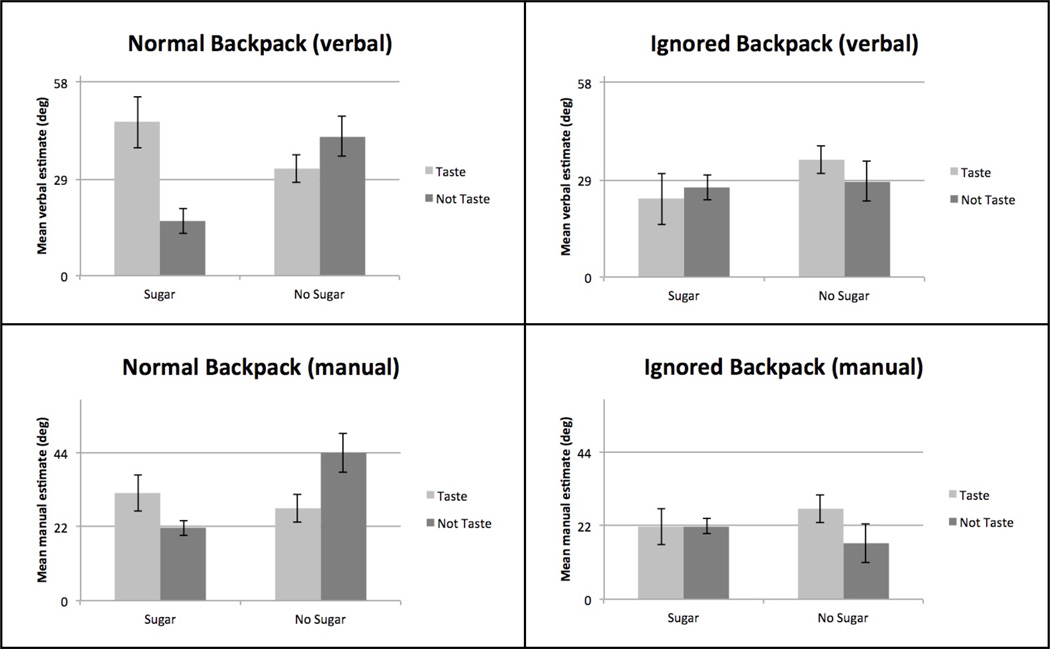
Figure 2.
Estimation data split by Demand (High Demand, left; Low Demand, right) and Measure (Verbal, above; Manual, below) and plotted as a function of both Sugar condition and self-reported sensory knowledge (Taste) of the condition. Gridlines (29° verbal; 22° manual) represent baseline estimates for this hill for the two measures. Standard errors of the means are shown.

