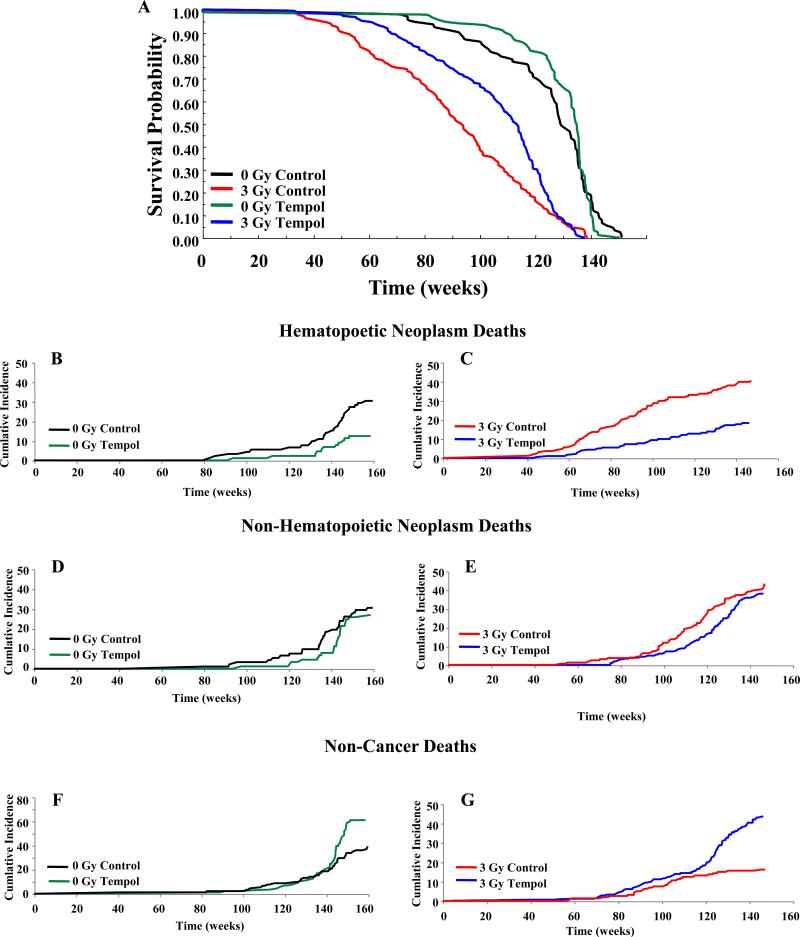
Figure 2.
A) Kaplan-Meier survival plots for CBA mice. Mice were exposed to either 0 or 3 Gy TBI with Tempol food supplementation initiated immediately after radiation and maintained throughout the lifespan. Statistics using log rank analysis of the survival curves: 0 Gy C vs 0 Gy T (p = 0.91); 3 Gy C vs 3 Gy T (p < 0.003). B) Cumulative incidence of deaths for various groups of CBA mice shown in A: hematopoietic neoplasms (B, C), non-HN (D, E), and non-cancer deaths (F, G).

